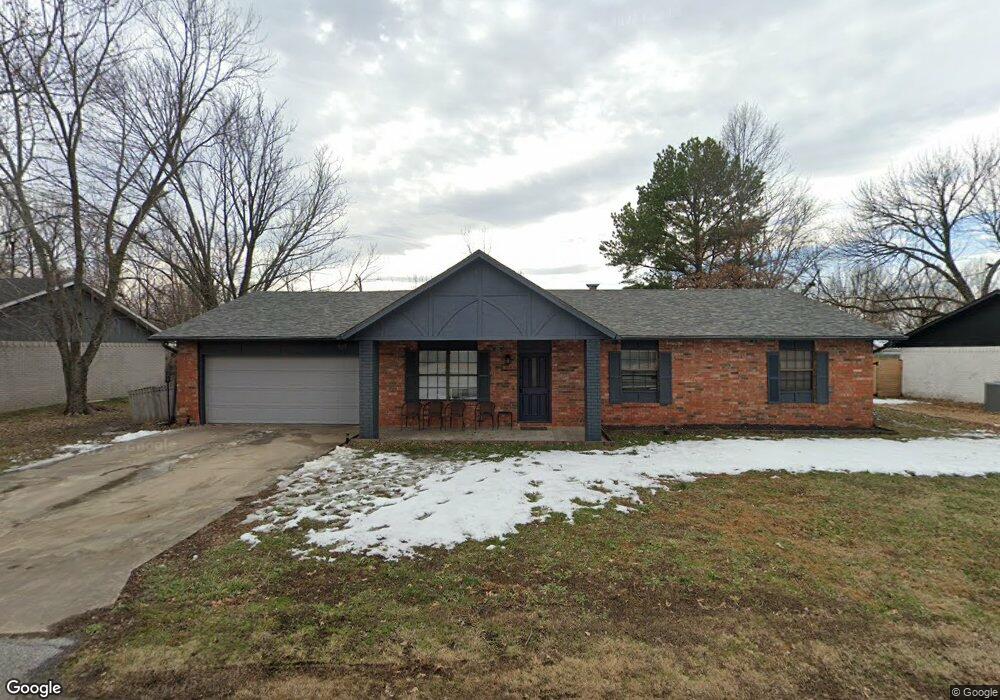
409 SW 10th St Bentonville, AR 72712
Estimated Value: $439,874 - $704,000
--
Bed
2
Baths
1,860
Sq Ft
$321/Sq Ft
Est. Value
About This Home
This home is located at 409 SW 10th St, Bentonville, AR 72712 and is currently estimated at $597,219, approximately $321 per square foot. 409 SW 10th St is a home located in Benton County with nearby schools including R.E. Baker Elementary School, Ruth Barker Middle School, and Washington Junior High School.
Ownership History
Date
Name
Owned For
Owner Type
Purchase Details
Closed on
Jul 30, 2001
Bought by
Bartchak
Current Estimated Value
Purchase Details
Closed on
Nov 5, 1994
Bought by
Hultquist Marvin Dean
Purchase Details
Closed on
Mar 19, 1993
Bought by
Hultquist
Purchase Details
Closed on
Feb 25, 1988
Bought by
Walker
Purchase Details
Closed on
Jun 1, 1984
Bought by
Newland Const
Purchase Details
Closed on
Sep 2, 1976
Bought by
Mccurry
Create a Home Valuation Report for This Property
The Home Valuation Report is an in-depth analysis detailing your home's value as well as a comparison with similar homes in the area
Home Values in the Area
Average Home Value in this Area
Purchase History
| Date | Buyer | Sale Price | Title Company |
|---|---|---|---|
| Bartchak | $90,000 | -- | |
| Hultquist Marvin Dean | -- | -- | |
| Hultquist | $63,000 | -- | |
| Walker | $56,000 | -- | |
| Newland Const | -- | -- | |
| Mccurry | $37,000 | -- |
Source: Public Records
Tax History Compared to Growth
Tax History
| Year | Tax Paid | Tax Assessment Tax Assessment Total Assessment is a certain percentage of the fair market value that is determined by local assessors to be the total taxable value of land and additions on the property. | Land | Improvement |
|---|---|---|---|---|
| 2025 | $2,222 | $95,834 | $15,000 | $80,834 |
| 2024 | $2,131 | $95,834 | $15,000 | $80,834 |
| 2023 | $2,030 | $42,680 | $8,600 | $34,080 |
| 2022 | $1,613 | $42,680 | $8,600 | $34,080 |
| 2021 | $1,516 | $42,680 | $8,600 | $34,080 |
| 2020 | $1,444 | $28,550 | $3,800 | $24,750 |
| 2019 | $1,444 | $28,550 | $3,800 | $24,750 |
| 2018 | $1,469 | $28,550 | $3,800 | $24,750 |
| 2017 | $1,402 | $28,550 | $3,800 | $24,750 |
| 2016 | $1,402 | $28,550 | $3,800 | $24,750 |
| 2015 | $1,611 | $27,050 | $5,900 | $21,150 |
| 2014 | $1,261 | $27,050 | $5,900 | $21,150 |
Source: Public Records
Map
Nearby Homes