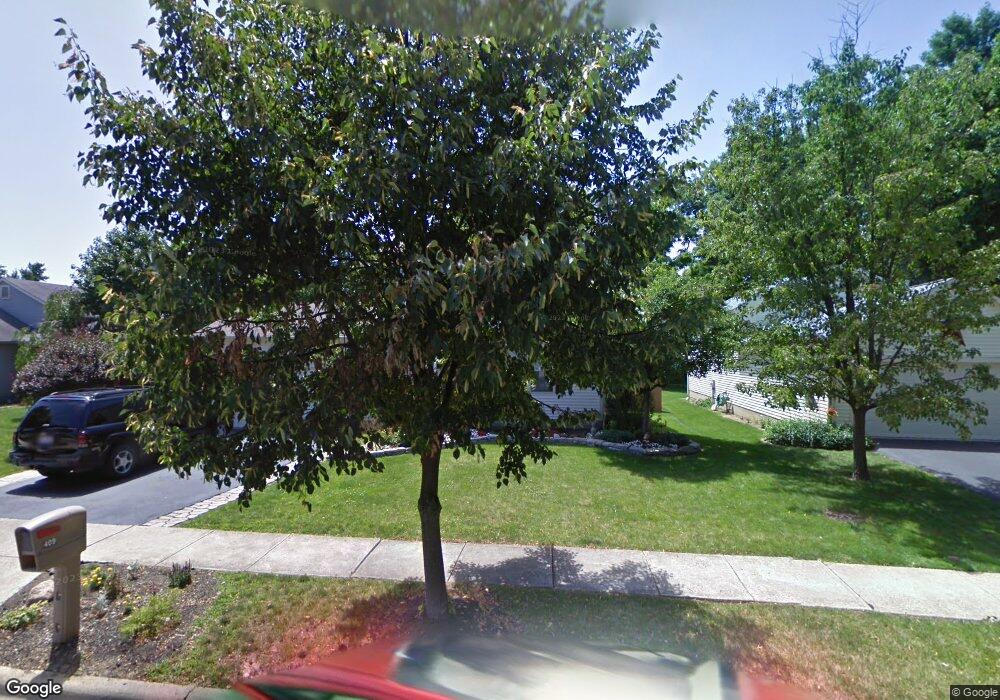
409 Tallman St Groveport, OH 43125
Estimated Value: $275,000 - $327,000
3
Beds
3
Baths
1,377
Sq Ft
$219/Sq Ft
Est. Value
About This Home
This home is located at 409 Tallman St, Groveport, OH 43125 and is currently estimated at $301,398, approximately $218 per square foot. 409 Tallman St is a home located in Franklin County with nearby schools including Groveport Madison High School, Groveport Community School, and Madison Christian School.
Ownership History
Date
Name
Owned For
Owner Type
Purchase Details
Closed on
Feb 3, 2000
Sold by
Watts Jeffrey A and Watts Monica L
Bought by
Robertson Timmy
Current Estimated Value
Home Financials for this Owner
Home Financials are based on the most recent Mortgage that was taken out on this home.
Original Mortgage
$124,100
Outstanding Balance
$40,784
Interest Rate
8.08%
Estimated Equity
$260,614
Purchase Details
Closed on
Jul 29, 1993
Create a Home Valuation Report for This Property
The Home Valuation Report is an in-depth analysis detailing your home's value as well as a comparison with similar homes in the area
Home Values in the Area
Average Home Value in this Area
Purchase History
| Date | Buyer | Sale Price | Title Company |
|---|---|---|---|
| Robertson Timmy | $120,800 | Amerititle Mill Run | |
| -- | $105,100 | -- |
Source: Public Records
Mortgage History
| Date | Status | Borrower | Loan Amount |
|---|---|---|---|
| Open | Robertson Timmy | $124,100 |
Source: Public Records
Tax History Compared to Growth
Tax History
| Year | Tax Paid | Tax Assessment Tax Assessment Total Assessment is a certain percentage of the fair market value that is determined by local assessors to be the total taxable value of land and additions on the property. | Land | Improvement |
|---|---|---|---|---|
| 2024 | $4,334 | $88,620 | $23,660 | $64,960 |
| 2023 | $4,544 | $88,620 | $23,660 | $64,960 |
| 2022 | $3,700 | $57,120 | $9,730 | $47,390 |
| 2021 | $3,713 | $57,120 | $9,730 | $47,390 |
| 2020 | $3,722 | $57,120 | $9,730 | $47,390 |
| 2019 | $3,540 | $47,780 | $8,120 | $39,660 |
| 2018 | $3,299 | $47,780 | $8,120 | $39,660 |
| 2017 | $3,249 | $47,780 | $8,120 | $39,660 |
| 2016 | $3,160 | $41,060 | $8,050 | $33,010 |
| 2015 | $3,188 | $41,060 | $8,050 | $33,010 |
| 2014 | $3,001 | $41,060 | $8,050 | $33,010 |
| 2013 | $1,347 | $43,225 | $8,470 | $34,755 |
Source: Public Records
Map
Nearby Homes