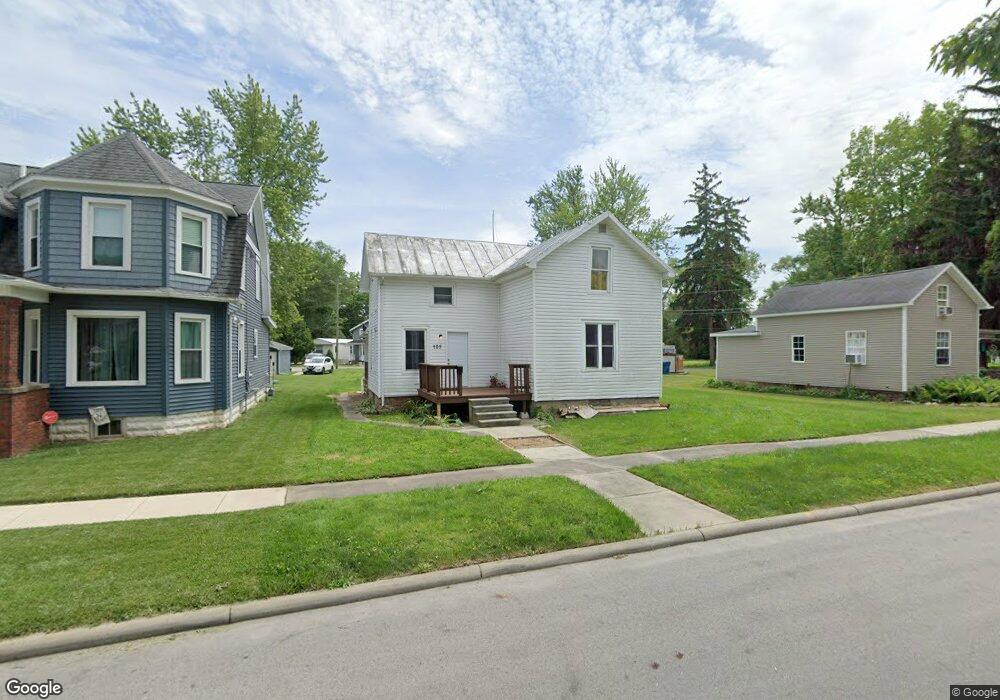
409 Tiffin St Fremont, OH 43420
Estimated Value: $61,415 - $157,000
3
Beds
1
Bath
1,366
Sq Ft
$83/Sq Ft
Est. Value
About This Home
This home is located at 409 Tiffin St, Fremont, OH 43420 and is currently estimated at $113,354, approximately $82 per square foot. 409 Tiffin St is a home located in Sandusky County with nearby schools including Fremont Ross High School, Bishop Hoffman Catholic School - This is St Joe's School now, and St. Joseph School.
Ownership History
Date
Name
Owned For
Owner Type
Purchase Details
Closed on
Sep 20, 2023
Sold by
Coleman Daniel D and Coleman Constance L
Bought by
Coleman Thomas P
Current Estimated Value
Purchase Details
Closed on
Jul 23, 1996
Sold by
Est Roland W Good
Bought by
Coleman Daniel D and Coleman Constance L
Home Financials for this Owner
Home Financials are based on the most recent Mortgage that was taken out on this home.
Original Mortgage
$110,000
Interest Rate
8.31%
Mortgage Type
New Conventional
Purchase Details
Closed on
Oct 1, 1991
Sold by
Coleman Daniel D and Coleman Cons
Bought by
Coleman Daniel D and Coleman Thomas
Purchase Details
Closed on
Sep 1, 1990
Sold by
Coleman Daniel D and Coleman Cons
Bought by
Coleman Daniel D and Coleman Thomas
Purchase Details
Closed on
Jun 1, 1984
Bought by
Coleman Daniel D and Coleman Thomas
Create a Home Valuation Report for This Property
The Home Valuation Report is an in-depth analysis detailing your home's value as well as a comparison with similar homes in the area
Home Values in the Area
Average Home Value in this Area
Purchase History
| Date | Buyer | Sale Price | Title Company |
|---|---|---|---|
| Coleman Thomas P | $20,000 | None Listed On Document | |
| Coleman Daniel D | $43,000 | -- | |
| Coleman Daniel D | $8,000 | -- | |
| Coleman Daniel D | -- | -- | |
| Coleman Daniel D | -- | -- |
Source: Public Records
Mortgage History
| Date | Status | Borrower | Loan Amount |
|---|---|---|---|
| Previous Owner | Coleman Daniel D | $110,000 |
Source: Public Records
Tax History Compared to Growth
Tax History
| Year | Tax Paid | Tax Assessment Tax Assessment Total Assessment is a certain percentage of the fair market value that is determined by local assessors to be the total taxable value of land and additions on the property. | Land | Improvement |
|---|---|---|---|---|
| 2024 | $917 | $27,020 | $10,010 | $17,010 |
| 2023 | $1,019 | $21,460 | $7,950 | $13,510 |
| 2022 | $850 | $21,460 | $7,950 | $13,510 |
| 2021 | $877 | $21,460 | $7,950 | $13,510 |
| 2020 | $1,586 | $18,800 | $7,950 | $10,850 |
| 2019 | $779 | $18,800 | $7,950 | $10,850 |
| 2018 | $771 | $18,800 | $7,950 | $10,850 |
| 2017 | $762 | $18,280 | $7,950 | $10,330 |
| 2016 | $670 | $18,280 | $7,950 | $10,330 |
| 2015 | $659 | $18,280 | $7,950 | $10,330 |
| 2014 | $656 | $17,330 | $7,880 | $9,450 |
| 2013 | $641 | $17,330 | $7,880 | $9,450 |
Source: Public Records
Map
Nearby Homes
- 515 S Arch St
- 619 Hayes Ave
- 625 Bush Place
- 616 S Wood St
- 815 South St
- 1015 Hayes Ave
- 905 Twinn St
- 1028 June St
- 1037 Buckland Ave
- 1013 Whittlesey St
- 208 E State St
- 600 S Buchanan St
- 0 S Buchanan St
- 224 Sandusky Ave Unit 226
- 427 N Clover St
- 906 Amsden Blvd
- 1009 Napoleon St
- 216 S Buchanan St
- 516 N Front St
- 714 E State St