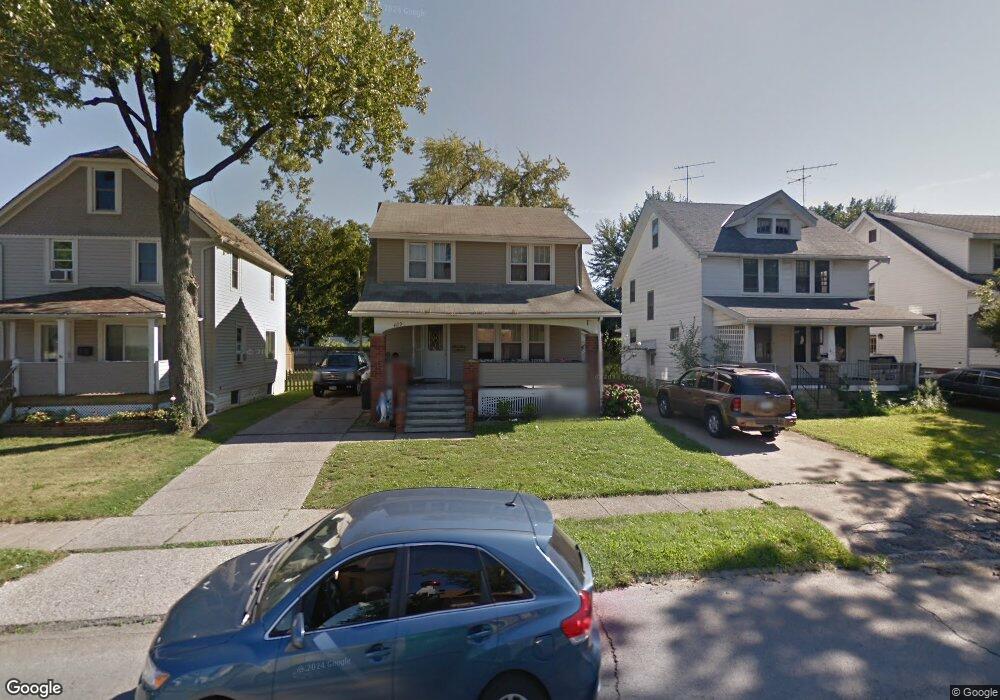
409 W 28th St Lorain, OH 44055
Estimated Value: $93,033 - $123,000
3
Beds
1
Bath
1,353
Sq Ft
$76/Sq Ft
Est. Value
About This Home
This home is located at 409 W 28th St, Lorain, OH 44055 and is currently estimated at $102,258, approximately $75 per square foot. 409 W 28th St is a home located in Lorain County with nearby schools including Garfield Elementary School, Gen. Johnnie Wilson Middle School, and Lorain High School.
Ownership History
Date
Name
Owned For
Owner Type
Purchase Details
Closed on
May 26, 2017
Sold by
Santiago Luis and Santiago Sandra
Bought by
Santiago Colon Luis O
Current Estimated Value
Home Financials for this Owner
Home Financials are based on the most recent Mortgage that was taken out on this home.
Original Mortgage
$33,900
Outstanding Balance
$27,885
Interest Rate
3.97%
Mortgage Type
New Conventional
Estimated Equity
$74,373
Purchase Details
Closed on
Nov 13, 2008
Sold by
Federal Home Loan Mortgage Corporation
Bought by
Santiago Luis and Santiago Sandra
Purchase Details
Closed on
Sep 11, 2008
Sold by
Tolliver Christopher E and Tolliver Gladys
Bought by
Federal Home Loan Mortgage Corporation
Purchase Details
Closed on
Jul 12, 2002
Sold by
Tolliver Rose M
Bought by
Tolliver Christopher E
Home Financials for this Owner
Home Financials are based on the most recent Mortgage that was taken out on this home.
Original Mortgage
$56,650
Interest Rate
6.8%
Create a Home Valuation Report for This Property
The Home Valuation Report is an in-depth analysis detailing your home's value as well as a comparison with similar homes in the area
Home Values in the Area
Average Home Value in this Area
Purchase History
| Date | Buyer | Sale Price | Title Company |
|---|---|---|---|
| Santiago Colon Luis O | -- | Miller Home Title | |
| Santiago Luis | -- | Attorney | |
| Federal Home Loan Mortgage Corporation | $40,000 | None Available | |
| Tolliver Christopher E | -- | Northstar Title Services |
Source: Public Records
Mortgage History
| Date | Status | Borrower | Loan Amount |
|---|---|---|---|
| Open | Santiago Colon Luis O | $33,900 | |
| Previous Owner | Tolliver Christopher E | $56,650 |
Source: Public Records
Tax History
| Year | Tax Paid | Tax Assessment Tax Assessment Total Assessment is a certain percentage of the fair market value that is determined by local assessors to be the total taxable value of land and additions on the property. | Land | Improvement |
|---|---|---|---|---|
| 2024 | $1,032 | $25,036 | $2,723 | $22,313 |
| 2023 | $1,023 | $19,870 | $2,461 | $17,409 |
| 2022 | $1,014 | $19,870 | $2,461 | $17,409 |
| 2021 | $1,014 | $19,870 | $2,460 | $17,410 |
| 2020 | $1,033 | $17,570 | $2,180 | $15,390 |
| 2019 | $1,027 | $17,570 | $2,180 | $15,390 |
| 2018 | $1,027 | $17,570 | $2,180 | $15,390 |
| 2017 | $967 | $15,210 | $2,860 | $12,350 |
| 2016 | $960 | $15,210 | $2,860 | $12,350 |
| 2015 | $907 | $15,210 | $2,860 | $12,350 |
| 2014 | $838 | $14,080 | $2,650 | $11,430 |
| 2013 | $832 | $14,080 | $2,650 | $11,430 |
Source: Public Records
Map
Nearby Homes
- 319 W 27th St
- 2349 Kelly Place
- V/L Broadway Ave
- 824 Highland Park Blvd
- 112 W 25th St
- 2334 Apple Ave
- 3116 Chris Ave
- 807 W 21st St
- 1012 W 29th St
- 2910 Caroline Ave
- 507 W 20th St
- 3177 Elyria Ave
- 707 W 20th St
- 3011 Caroline Ave
- 125 W 35th St
- 935 W 22nd St
- 902 W 21st St
- 2909 Denver Ave
- 510 E 25th St
- 3030 Kay Ave
Your Personal Tour Guide
Ask me questions while you tour the home.