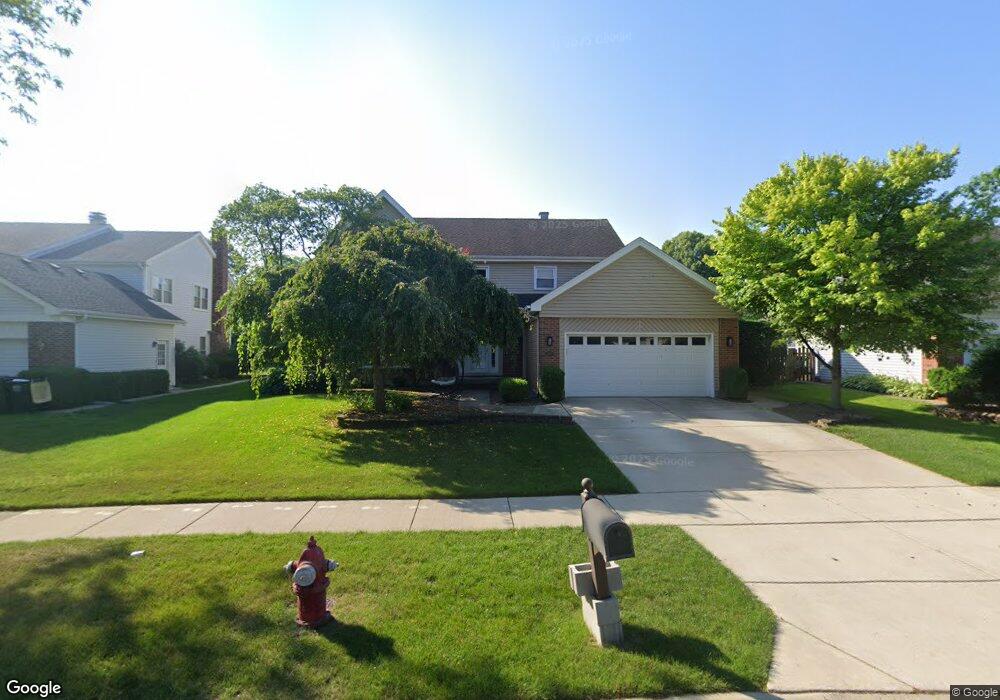
409 W Brampton Ln Unit 2 Arlington Heights, IL 60004
Terramere NeighborhoodEstimated Value: $687,000 - $1,002,000
4
Beds
4
Baths
2,607
Sq Ft
$298/Sq Ft
Est. Value
About This Home
This home is located at 409 W Brampton Ln Unit 2, Arlington Heights, IL 60004 and is currently estimated at $778,157, approximately $298 per square foot. 409 W Brampton Ln Unit 2 is a home located in Cook County with nearby schools including Henry W Longfellow Elementary School, Cooper Middle School, and Buffalo Grove High School.
Ownership History
Date
Name
Owned For
Owner Type
Purchase Details
Closed on
Jun 24, 2011
Sold by
Racz Nicholas and Racz Mary
Bought by
Gordon Todd and Gordon Emilie
Current Estimated Value
Home Financials for this Owner
Home Financials are based on the most recent Mortgage that was taken out on this home.
Original Mortgage
$340,000
Outstanding Balance
$234,389
Interest Rate
4.63%
Mortgage Type
New Conventional
Estimated Equity
$543,768
Purchase Details
Closed on
Sep 8, 2000
Sold by
Wajda Edward F and Wajda Janice M
Bought by
Racz Nicholas and Racz Mary
Home Financials for this Owner
Home Financials are based on the most recent Mortgage that was taken out on this home.
Original Mortgage
$200,000
Interest Rate
8.14%
Purchase Details
Closed on
Apr 27, 1994
Sold by
Kerns Richard A and Kerns Beverly P
Bought by
Wajda Edward F and Wajda Janice M
Home Financials for this Owner
Home Financials are based on the most recent Mortgage that was taken out on this home.
Original Mortgage
$172,500
Interest Rate
7.88%
Create a Home Valuation Report for This Property
The Home Valuation Report is an in-depth analysis detailing your home's value as well as a comparison with similar homes in the area
Home Values in the Area
Average Home Value in this Area
Purchase History
| Date | Buyer | Sale Price | Title Company |
|---|---|---|---|
| Gordon Todd | $492,500 | Chicago Title Insurance Co | |
| Racz Nicholas | $413,000 | -- | |
| Wajda Edward F | $258,500 | Intercounty Title |
Source: Public Records
Mortgage History
| Date | Status | Borrower | Loan Amount |
|---|---|---|---|
| Open | Gordon Todd | $340,000 | |
| Previous Owner | Racz Nicholas | $200,000 | |
| Previous Owner | Wajda Edward F | $172,500 |
Source: Public Records
Tax History Compared to Growth
Tax History
| Year | Tax Paid | Tax Assessment Tax Assessment Total Assessment is a certain percentage of the fair market value that is determined by local assessors to be the total taxable value of land and additions on the property. | Land | Improvement |
|---|---|---|---|---|
| 2024 | $14,317 | $49,000 | $13,669 | $35,331 |
| 2023 | $13,614 | $49,000 | $13,669 | $35,331 |
| 2022 | $13,614 | $49,000 | $13,669 | $35,331 |
| 2021 | $13,515 | $42,398 | $9,021 | $33,377 |
| 2020 | $13,232 | $42,398 | $9,021 | $33,377 |
| 2019 | $13,230 | $46,849 | $9,021 | $37,828 |
| 2018 | $13,622 | $43,486 | $7,927 | $35,559 |
| 2017 | $13,390 | $43,486 | $7,927 | $35,559 |
| 2016 | $12,796 | $43,486 | $7,927 | $35,559 |
| 2015 | $15,131 | $47,211 | $6,834 | $40,377 |
| 2014 | $14,928 | $47,211 | $6,834 | $40,377 |
| 2013 | $14,678 | $47,211 | $6,834 | $40,377 |
Source: Public Records
Map
Nearby Homes
- 715 W Whiting Ln
- 811 W Nichols Rd
- 812 W Whiting Ln
- 921 Bernard Dr
- 715 W Happfield Dr
- 751 W Happfield Dr Unit 30
- 705 Grove Dr Unit 101
- 1112 Auburn Ln
- 535 Estate Dr
- 859 Beechwood Rd
- 571 Estate Dr
- 720 Weidner Rd Unit 302
- 4121 N Mallard Dr Unit 5
- 1631 W Partridge Ct Unit 8
- 872 Old Checker Rd Unit E3
- 820 Weidner Rd Unit 4013
- 820 Weidner Rd Unit 409
- 746 Old Checker Rd Unit E5
- 1854 Checker Rd
- 310 Rosewood Ave
- 405 W Brampton Ln
- 415 W Brampton Ln
- 4032 N Highland Ave
- 4029 N Mitchell Dr
- 315 W Brampton Ln
- 4036 N Highland Ave
- 4028 N Highland Ave
- 412 W Brampton Ln
- 416 W Brampton Ln
- 4040 N Highland Ave
- 4025 N Mitchell Dr
- 408 W Brampton Ln
- 311 W Brampton Ln
- 420 W Brampton Ln
- 4024 N Highland Ave
- 4104 N Highland Ave
- 404 W Brampton Ln
- 4026 N Mitchell Dr Unit 2
- 4021 N Mitchell Dr
- 506 W Brampton Ln