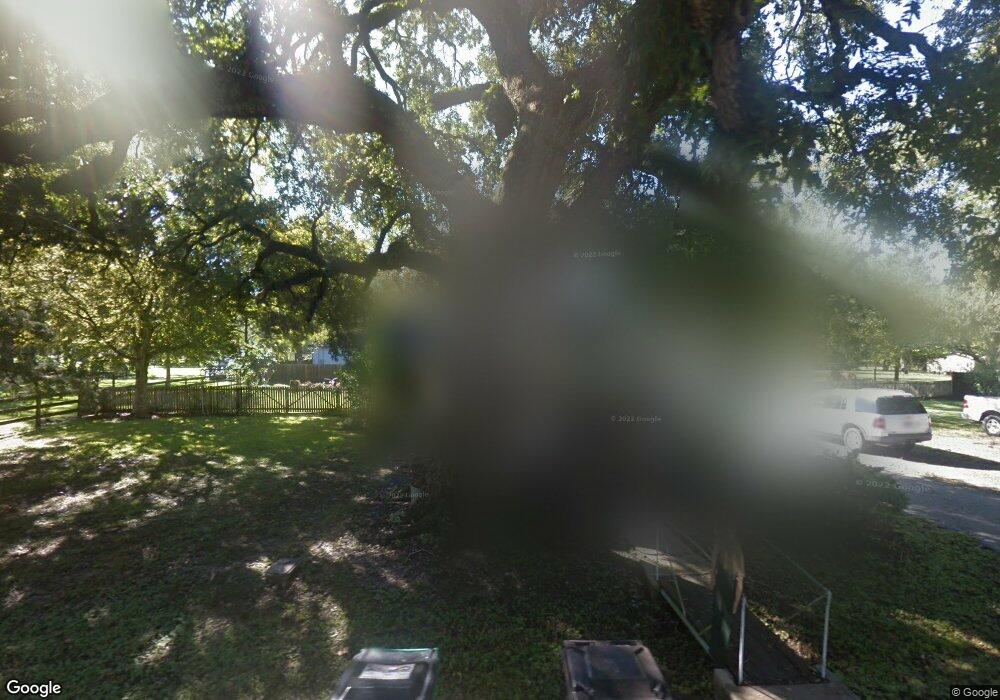
409 W Smith St Brazoria, TX 77422
Estimated Value: $143,000 - $224,000
--
Bed
1
Bath
1,181
Sq Ft
$140/Sq Ft
Est. Value
About This Home
This home is located at 409 W Smith St, Brazoria, TX 77422 and is currently estimated at $165,282, approximately $139 per square foot. 409 W Smith St is a home located in Brazoria County.
Ownership History
Date
Name
Owned For
Owner Type
Purchase Details
Closed on
May 9, 1997
Sold by
Demmon Alice B and Frizzell Alice B
Bought by
Morgan George A and Morgan Karen S
Current Estimated Value
Home Financials for this Owner
Home Financials are based on the most recent Mortgage that was taken out on this home.
Original Mortgage
$46,750
Outstanding Balance
$6,492
Interest Rate
8.16%
Estimated Equity
$158,790
Purchase Details
Closed on
May 1, 1997
Sold by
Morgan George Allen and Morgan Karen Sue
Bought by
Jordan John David and Jordan Tina
Home Financials for this Owner
Home Financials are based on the most recent Mortgage that was taken out on this home.
Original Mortgage
$46,750
Outstanding Balance
$6,492
Interest Rate
8.16%
Estimated Equity
$158,790
Create a Home Valuation Report for This Property
The Home Valuation Report is an in-depth analysis detailing your home's value as well as a comparison with similar homes in the area
Home Values in the Area
Average Home Value in this Area
Purchase History
| Date | Buyer | Sale Price | Title Company |
|---|---|---|---|
| Morgan George A | -- | -- | |
| Jordan John David | -- | -- |
Source: Public Records
Mortgage History
| Date | Status | Borrower | Loan Amount |
|---|---|---|---|
| Open | Morgan George A | $46,750 | |
| Closed | Jordan John David | $31,800 |
Source: Public Records
Tax History Compared to Growth
Tax History
| Year | Tax Paid | Tax Assessment Tax Assessment Total Assessment is a certain percentage of the fair market value that is determined by local assessors to be the total taxable value of land and additions on the property. | Land | Improvement |
|---|---|---|---|---|
| 2025 | $1,397 | $118,700 | $33,080 | $85,620 |
| 2023 | $1,397 | $124,061 | $35,410 | $102,560 |
| 2022 | $2,548 | $112,783 | $31,250 | $98,300 |
| 2021 | $2,416 | $102,530 | $27,080 | $75,450 |
| 2020 | $2,328 | $98,850 | $25,000 | $73,850 |
| 2019 | $2,184 | $85,550 | $13,390 | $72,160 |
| 2018 | $2,248 | $87,570 | $13,230 | $74,340 |
| 2017 | $2,222 | $87,570 | $13,230 | $74,340 |
| 2016 | $2,020 | $83,500 | $11,030 | $72,470 |
| 2014 | $1,342 | $62,900 | $11,030 | $51,870 |
Source: Public Records
Map
Nearby Homes