Estimated Value: $145,000 - $155,000
3
Beds
2
Baths
1,802
Sq Ft
$83/Sq Ft
Est. Value
About This Home
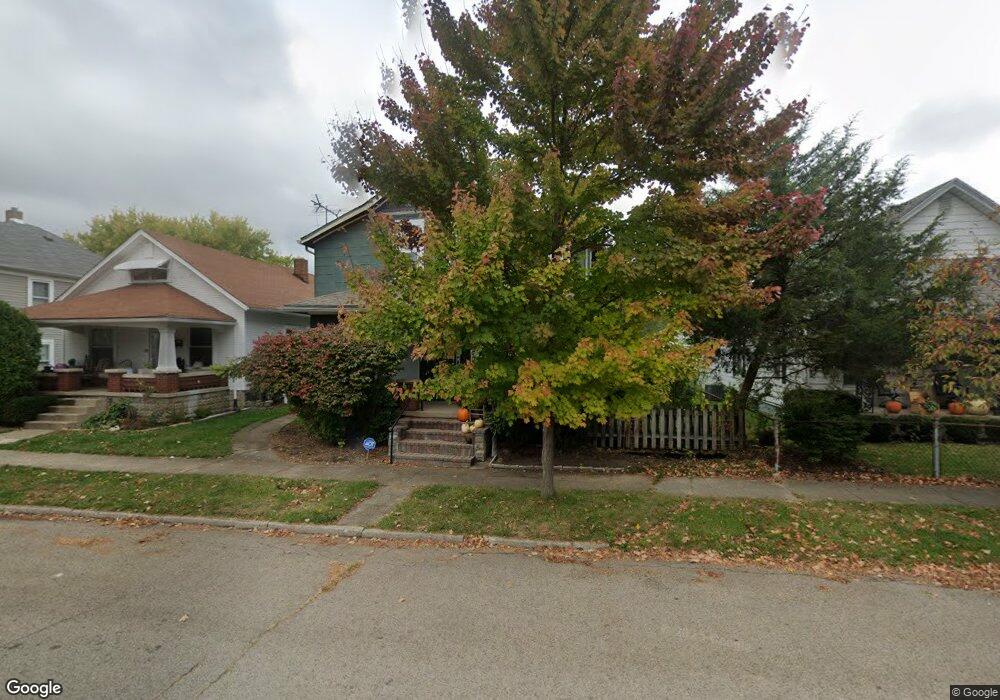
This home is located at 409 Walnut St, Xenia, OH 45385 and is currently estimated at $150,295, approximately $83 per square foot. 409 Walnut St is a home located in Greene County with nearby schools including Xenia High School, Summit Academy Community School for Alternative Learners - Xenia, and Legacy Christian Academy.
Ownership History
Date
Name
Owned For
Owner Type
Purchase Details
Closed on
Nov 16, 2016
Sold by
Stevens Pamela S
Bought by
Kramer Valerie J
Current Estimated Value
Home Financials for this Owner
Home Financials are based on the most recent Mortgage that was taken out on this home.
Original Mortgage
$64,800
Outstanding Balance
$52,048
Interest Rate
3.52%
Mortgage Type
Future Advance Clause Open End Mortgage
Estimated Equity
$98,247
Purchase Details
Closed on
Apr 15, 2012
Sold by
Gray Shayne Anthony and Gray Sara Miller
Bought by
Stevens Pamela S
Purchase Details
Closed on
Apr 17, 1998
Sold by
Duffy William B and Duffy Mary D
Bought by
Gray Shayne Anthony and Gray Sara Miller
Home Financials for this Owner
Home Financials are based on the most recent Mortgage that was taken out on this home.
Original Mortgage
$64,600
Interest Rate
7.26%
Create a Home Valuation Report for This Property
The Home Valuation Report is an in-depth analysis detailing your home's value as well as a comparison with similar homes in the area
Home Values in the Area
Average Home Value in this Area
Purchase History
| Date | Buyer | Sale Price | Title Company |
|---|---|---|---|
| Kramer Valerie J | $72,000 | Attorney | |
| Stevens Pamela S | $70,000 | None Available | |
| Gray Shayne Anthony | $68,000 | -- |
Source: Public Records
Mortgage History
| Date | Status | Borrower | Loan Amount |
|---|---|---|---|
| Open | Kramer Valerie J | $64,800 | |
| Previous Owner | Gray Shayne Anthony | $64,600 |
Source: Public Records
Tax History Compared to Growth
Tax History
| Year | Tax Paid | Tax Assessment Tax Assessment Total Assessment is a certain percentage of the fair market value that is determined by local assessors to be the total taxable value of land and additions on the property. | Land | Improvement |
|---|---|---|---|---|
| 2024 | $1,721 | $40,220 | $4,630 | $35,590 |
| 2023 | $1,721 | $40,220 | $4,630 | $35,590 |
| 2022 | $1,509 | $30,070 | $3,700 | $26,370 |
| 2021 | $1,529 | $30,070 | $3,700 | $26,370 |
| 2020 | $1,465 | $30,070 | $3,700 | $26,370 |
| 2019 | $1,441 | $27,840 | $3,710 | $24,130 |
| 2018 | $1,446 | $27,840 | $3,710 | $24,130 |
| 2017 | $1,404 | $27,840 | $3,710 | $24,130 |
| 2016 | $1,375 | $25,970 | $3,710 | $22,260 |
| 2015 | $1,068 | $25,970 | $3,710 | $22,260 |
| 2014 | $1,320 | $25,970 | $3,710 | $22,260 |
Source: Public Records
Map
Nearby Homes