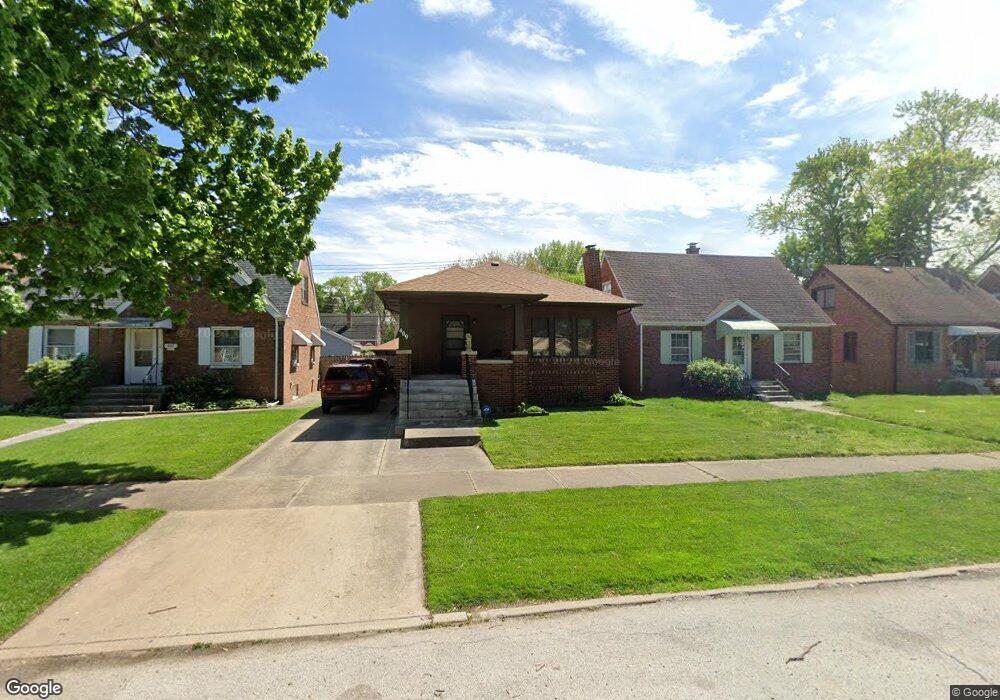
409 Webb St Calumet City, IL 60409
Estimated Value: $91,000 - $153,000
2
Beds
1
Bath
864
Sq Ft
$149/Sq Ft
Est. Value
About This Home
This home is located at 409 Webb St, Calumet City, IL 60409 and is currently estimated at $128,664, approximately $148 per square foot. 409 Webb St is a home located in Cook County with nearby schools including Lincoln Elementary School, Thornton Fractional North High School, and Hammond Academy Of Science & Tech.
Ownership History
Date
Name
Owned For
Owner Type
Purchase Details
Closed on
Oct 18, 2005
Sold by
Lendabarker John R
Bought by
Lendabarker John R and Lendabarker Lisa J
Current Estimated Value
Purchase Details
Closed on
May 11, 1998
Sold by
Lendabarker Chiyo
Bought by
Lendabarker John R
Home Financials for this Owner
Home Financials are based on the most recent Mortgage that was taken out on this home.
Original Mortgage
$35,000
Interest Rate
7.32%
Create a Home Valuation Report for This Property
The Home Valuation Report is an in-depth analysis detailing your home's value as well as a comparison with similar homes in the area
Home Values in the Area
Average Home Value in this Area
Purchase History
| Date | Buyer | Sale Price | Title Company |
|---|---|---|---|
| Lendabarker John R | -- | None Available | |
| Lendabarker John R | -- | -- |
Source: Public Records
Mortgage History
| Date | Status | Borrower | Loan Amount |
|---|---|---|---|
| Closed | Lendabarker John R | $35,000 |
Source: Public Records
Tax History Compared to Growth
Tax History
| Year | Tax Paid | Tax Assessment Tax Assessment Total Assessment is a certain percentage of the fair market value that is determined by local assessors to be the total taxable value of land and additions on the property. | Land | Improvement |
|---|---|---|---|---|
| 2024 | $2,230 | $10,000 | $1,872 | $8,128 |
| 2023 | -- | $10,000 | $1,872 | $8,128 |
| 2022 | $0 | $6,787 | $1,638 | $5,149 |
| 2021 | $11 | $6,787 | $1,638 | $5,149 |
| 2020 | $9 | $6,787 | $1,638 | $5,149 |
| 2019 | $0 | $6,188 | $1,521 | $4,667 |
| 2018 | $0 | $6,188 | $1,521 | $4,667 |
| 2017 | $0 | $6,188 | $1,521 | $4,667 |
| 2016 | $1,233 | $6,188 | $1,404 | $4,784 |
| 2015 | $1,056 | $6,188 | $1,404 | $4,784 |
| 2014 | $2,257 | $6,188 | $1,404 | $4,784 |
| 2013 | $2,579 | $7,183 | $1,404 | $5,779 |
Source: Public Records
Map
Nearby Homes