Estimated Value: $221,471 - $251,000
4
Beds
1
Bath
1,770
Sq Ft
$132/Sq Ft
Est. Value
About This Home
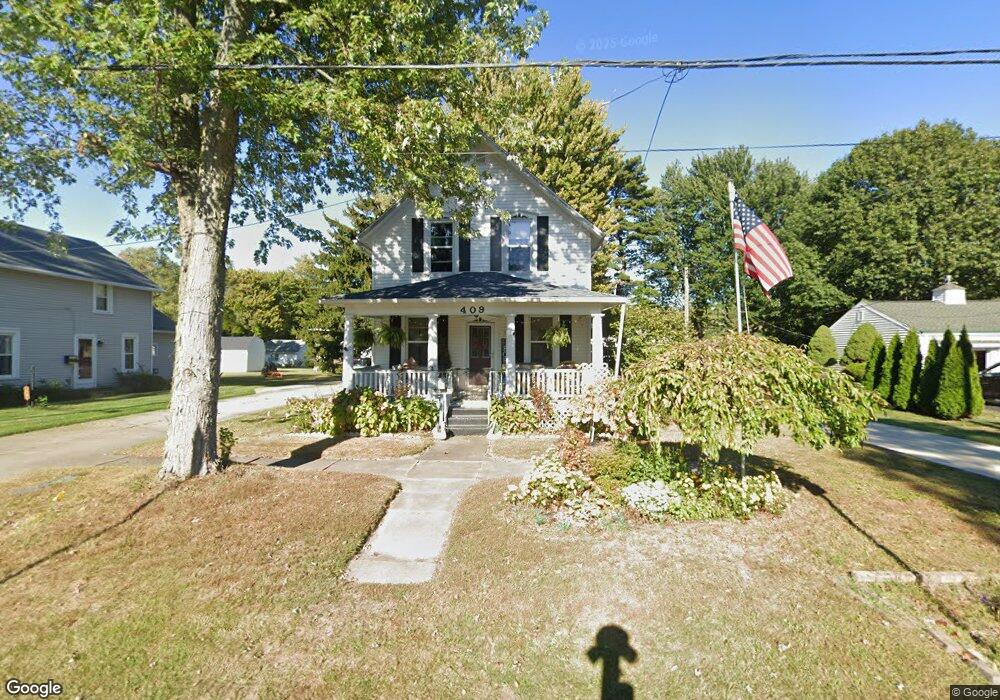
This home is located at 409 Wilbor Ave, Huron, OH 44839 and is currently estimated at $233,618, approximately $131 per square foot. 409 Wilbor Ave is a home located in Erie County with nearby schools including Shawnee Elementary School, Woodlands Intermediate School, and McCormick Junior High School.
Ownership History
Date
Name
Owned For
Owner Type
Purchase Details
Closed on
Feb 28, 2002
Sold by
Pribanic Chris J
Bought by
Emery Sammy and Emery Thelma
Current Estimated Value
Home Financials for this Owner
Home Financials are based on the most recent Mortgage that was taken out on this home.
Original Mortgage
$93,200
Outstanding Balance
$38,548
Interest Rate
6.92%
Mortgage Type
New Conventional
Estimated Equity
$195,070
Purchase Details
Closed on
Feb 12, 1997
Sold by
Smith Vee L
Bought by
Pribanic Chris J and Pribanic Constance A
Home Financials for this Owner
Home Financials are based on the most recent Mortgage that was taken out on this home.
Original Mortgage
$99,750
Interest Rate
7.74%
Mortgage Type
New Conventional
Purchase Details
Closed on
Mar 1, 1996
Sold by
Swanbeck C Raymond
Bought by
Marsinick Vee L
Home Financials for this Owner
Home Financials are based on the most recent Mortgage that was taken out on this home.
Original Mortgage
$74,000
Interest Rate
7.07%
Mortgage Type
New Conventional
Create a Home Valuation Report for This Property
The Home Valuation Report is an in-depth analysis detailing your home's value as well as a comparison with similar homes in the area
Home Values in the Area
Average Home Value in this Area
Purchase History
| Date | Buyer | Sale Price | Title Company |
|---|---|---|---|
| Emery Sammy | $116,500 | -- | |
| Pribanic Chris J | $105,000 | -- | |
| Marsinick Vee L | $85,000 | -- |
Source: Public Records
Mortgage History
| Date | Status | Borrower | Loan Amount |
|---|---|---|---|
| Open | Emery Sammy | $93,200 | |
| Previous Owner | Pribanic Chris J | $99,750 | |
| Previous Owner | Marsinick Vee L | $74,000 |
Source: Public Records
Tax History
| Year | Tax Paid | Tax Assessment Tax Assessment Total Assessment is a certain percentage of the fair market value that is determined by local assessors to be the total taxable value of land and additions on the property. | Land | Improvement |
|---|---|---|---|---|
| 2024 | $2,303 | $55,257 | $10,720 | $44,537 |
| 2023 | $2,349 | $50,508 | $9,425 | $41,083 |
| 2022 | $2,096 | $50,501 | $9,425 | $41,076 |
| 2021 | $2,090 | $50,510 | $9,430 | $41,080 |
| 2020 | $1,784 | $42,000 | $9,430 | $32,570 |
| 2019 | $1,862 | $42,000 | $9,430 | $32,570 |
| 2018 | $1,872 | $42,000 | $9,430 | $32,570 |
| 2017 | $1,715 | $37,390 | $11,550 | $25,840 |
| 2016 | $1,660 | $37,390 | $11,550 | $25,840 |
| 2015 | $1,658 | $37,390 | $11,550 | $25,840 |
| 2014 | $1,678 | $37,390 | $11,550 | $25,840 |
| 2013 | $1,654 | $37,390 | $11,550 | $25,840 |
Source: Public Records
Map
Nearby Homes
- 418 Adams Ave
- 535 Wilbor Ave
- 525 Liberty Dr Unit A
- 676 Salem Dr
- 0 Main St
- 323 Portland Dr
- 0 W Cleveland Rd
- 937 Main St
- 919 Glenview Dr
- 28 Turtle Bay
- 128 N Port Ln
- 11 Turtle Bay
- 927 Dallas Dr
- 706 Creekside Dr
- 721 Creekside Dr
- 317 Chevy Dr
- 216 Chevy Dr
- 304 Lisa Ann Dr
- 807 Cleveland Rd W
- 1114 Mudbrook Rd
Your Personal Tour Guide
Ask me questions while you tour the home.