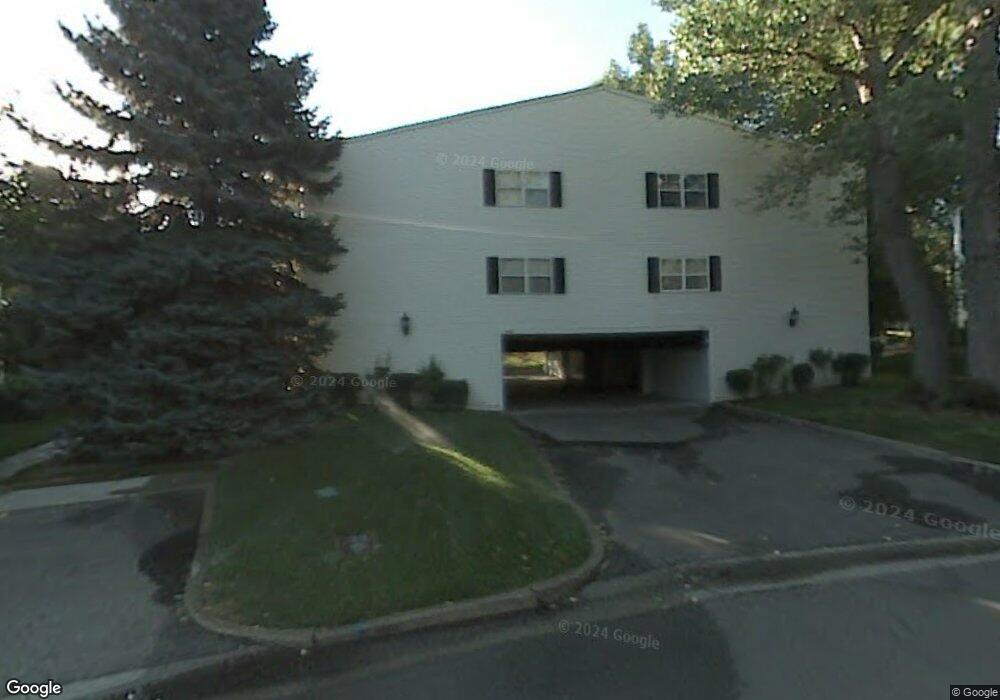
4090 S 670 E Unit A Salt Lake City, UT 84107
Estimated Value: $410,000 - $440,000
2
Beds
2
Baths
1,320
Sq Ft
$321/Sq Ft
Est. Value
About This Home
This home is located at 4090 S 670 E Unit A, Salt Lake City, UT 84107 and is currently estimated at $423,735, approximately $321 per square foot. 4090 S 670 E Unit A is a home located in Salt Lake County with nearby schools including James E Moss Elementary School, Bonneville Junior High School, and Cottonwood High School.
Ownership History
Date
Name
Owned For
Owner Type
Purchase Details
Closed on
Sep 26, 2024
Sold by
Noble Brittany and Noble Mark
Bought by
Lendo Megan
Current Estimated Value
Home Financials for this Owner
Home Financials are based on the most recent Mortgage that was taken out on this home.
Original Mortgage
$382,500
Outstanding Balance
$378,584
Interest Rate
6.49%
Mortgage Type
New Conventional
Estimated Equity
$45,151
Purchase Details
Closed on
Aug 4, 2022
Sold by
Call Val J
Bought by
Noble Brittany and Noble Mark
Purchase Details
Closed on
Jun 3, 2022
Sold by
Michelle Iverson
Bought by
Val J Call And Bay Renovations Llc
Purchase Details
Closed on
Nov 18, 2020
Sold by
Iverson Michelle
Bought by
Iverson Michelle
Purchase Details
Closed on
Nov 18, 2010
Sold by
Chamberlain Joyce L
Bought by
Chamberlain Joyce Larue and Joyce Larue Chamberlain Trust
Create a Home Valuation Report for This Property
The Home Valuation Report is an in-depth analysis detailing your home's value as well as a comparison with similar homes in the area
Home Values in the Area
Average Home Value in this Area
Purchase History
| Date | Buyer | Sale Price | Title Company |
|---|---|---|---|
| Lendo Megan | -- | Cottonwood Title | |
| Noble Brittany | -- | Title One Title | |
| Val J Call And Bay Renovations Llc | -- | Cottonwood Title | |
| Iverson Michelle | -- | None Available | |
| Chamberlain Joyce Larue | -- | None Available |
Source: Public Records
Mortgage History
| Date | Status | Borrower | Loan Amount |
|---|---|---|---|
| Open | Lendo Megan | $382,500 |
Source: Public Records
Tax History Compared to Growth
Tax History
| Year | Tax Paid | Tax Assessment Tax Assessment Total Assessment is a certain percentage of the fair market value that is determined by local assessors to be the total taxable value of land and additions on the property. | Land | Improvement |
|---|---|---|---|---|
| 2025 | $2,692 | $427,000 | $128,100 | $298,900 |
| 2024 | $2,692 | $419,100 | $125,700 | $293,400 |
| 2023 | $2,668 | $400,700 | $120,200 | $280,500 |
| 2022 | $2,041 | $308,700 | $92,600 | $216,100 |
| 2021 | $1,895 | $248,400 | $74,500 | $173,900 |
| 2020 | $1,803 | $223,500 | $67,000 | $156,500 |
| 2019 | $1,676 | $202,800 | $60,800 | $142,000 |
| 2018 | $0 | $195,300 | $58,600 | $136,700 |
| 2017 | $1,449 | $176,700 | $53,000 | $123,700 |
| 2016 | $1,357 | $167,400 | $50,200 | $117,200 |
| 2015 | $1,381 | $159,400 | $47,800 | $111,600 |
| 2014 | $1,397 | $157,800 | $47,300 | $110,500 |
Source: Public Records
Map
Nearby Homes
- 657 E 4065 S Unit C
- 4040 S 685 E Unit F
- 4040 S 685 E Unit F
- 651 E 4025 S Unit G
- 607 E 4030 S
- 665 E 4025 S Unit H
- 689 E 4149 S
- 635 E 4025 S Unit C
- 584 E 3990 S
- 4178 S 650 E
- 779 E 4070 S
- 4247 S 615 E
- 4264 S Steele Creek Ct
- 830 E Grand Cayman Dr
- 825 E 3990 S Unit C
- 842 E 4170 S
- 832 E 4170 S
- 838 E 4170 S
- 834 E 4170 S
- 495 E Mary Rose Dr
- 4090 S 670 E Unit B
- 4090 S 670 E Unit D
- 4090 S 670 E Unit C
- 4090 S 670 E Unit E
- 4090 S 670 E
- 4107 S 670 E Unit C
- 4107 S 670 E Unit B
- 4107 S 670 E Unit D
- 4107 S 670 E Unit A
- 4107 S 670 E Unit A
- 4092 S 670 E Unit F
- 4092 S 670 E Unit E
- 4092 S 670 E Unit H
- 4092 S 670 E Unit G
- 4092 S 670 E
- 648 E 4065 S Unit H
- 648 E 4065 S Unit G
- 648 E 4065 S Unit F
- 648 E 4065 S Unit 280H
- 4108 S 670 E Unit D