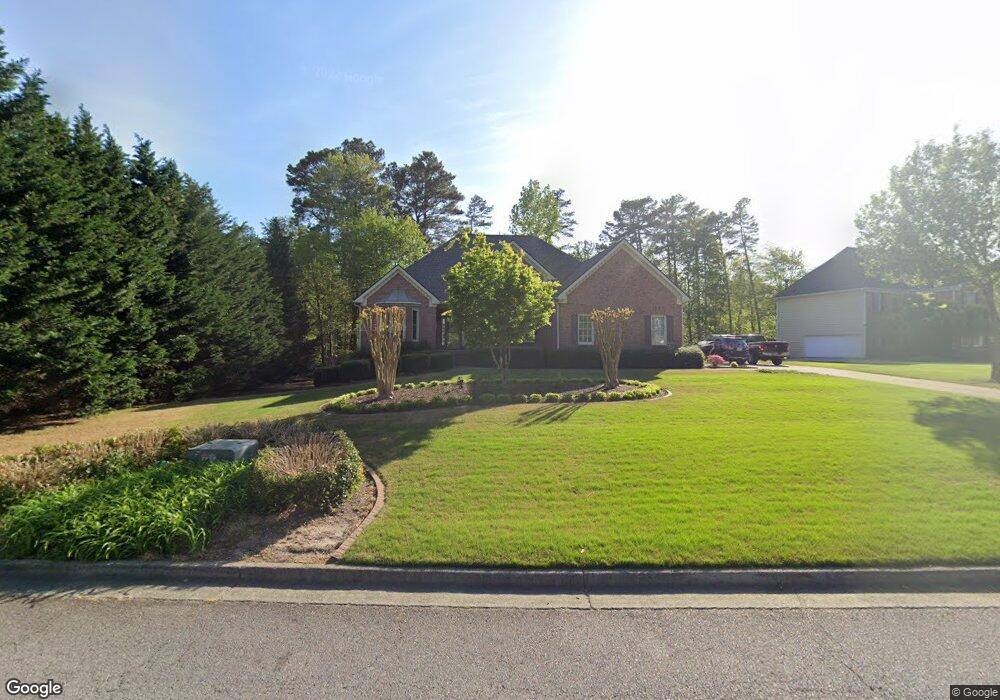
4091 Muddy River Ln Unit 1 Buford, GA 30519
Estimated Value: $519,000 - $563,609
3
Beds
3
Baths
4,737
Sq Ft
$116/Sq Ft
Est. Value
About This Home
This home is located at 4091 Muddy River Ln Unit 1, Buford, GA 30519 and is currently estimated at $551,652, approximately $116 per square foot. 4091 Muddy River Ln Unit 1 is a home located in Hall County with nearby schools including Friendship Elementary School, C.W. Davis Middle School, and Flowery Branch High School.
Ownership History
Date
Name
Owned For
Owner Type
Purchase Details
Closed on
Apr 11, 2013
Sold by
Broadbent Albert W
Bought by
Kotula Leroy A and Kotula Susan C
Current Estimated Value
Home Financials for this Owner
Home Financials are based on the most recent Mortgage that was taken out on this home.
Original Mortgage
$195,000
Outstanding Balance
$138,760
Interest Rate
3.65%
Mortgage Type
New Conventional
Estimated Equity
$412,892
Purchase Details
Closed on
May 6, 1999
Sold by
Chandler Hawkins Inc
Bought by
Broadbent Albert W and Broadbent Donna
Home Financials for this Owner
Home Financials are based on the most recent Mortgage that was taken out on this home.
Original Mortgage
$221,393
Interest Rate
6.87%
Mortgage Type
New Conventional
Purchase Details
Closed on
Oct 23, 1998
Sold by
Lynnwood Properties Inc
Bought by
Chandler-Hawkins Inc
Create a Home Valuation Report for This Property
The Home Valuation Report is an in-depth analysis detailing your home's value as well as a comparison with similar homes in the area
Home Values in the Area
Average Home Value in this Area
Purchase History
| Date | Buyer | Sale Price | Title Company |
|---|---|---|---|
| Kotula Leroy A | $255,000 | -- | |
| Broadbent Albert W | $220,000 | -- | |
| Chandler-Hawkins Inc | $102,000 | -- |
Source: Public Records
Mortgage History
| Date | Status | Borrower | Loan Amount |
|---|---|---|---|
| Open | Kotula Leroy A | $195,000 | |
| Previous Owner | Broadbent Albert W | $221,393 |
Source: Public Records
Tax History Compared to Growth
Tax History
| Year | Tax Paid | Tax Assessment Tax Assessment Total Assessment is a certain percentage of the fair market value that is determined by local assessors to be the total taxable value of land and additions on the property. | Land | Improvement |
|---|---|---|---|---|
| 2024 | $1,701 | $194,680 | $33,640 | $161,040 |
| 2023 | $1,669 | $204,280 | $35,480 | $168,800 |
| 2022 | $1,605 | $168,720 | $20,240 | $148,480 |
| 2021 | $1,450 | $142,880 | $10,560 | $132,320 |
| 2020 | $1,433 | $137,920 | $10,560 | $127,360 |
| 2019 | $1,416 | $132,800 | $10,560 | $122,240 |
| 2018 | $3,671 | $127,120 | $10,200 | $116,920 |
| 2017 | $3,446 | $120,440 | $10,200 | $110,240 |
| 2016 | $3,363 | $128,320 | $10,200 | $118,120 |
| 2015 | $2,936 | $102,155 | $8,160 | $93,995 |
| 2014 | $2,936 | $102,155 | $8,160 | $93,995 |
Source: Public Records
Map
Nearby Homes
- 2843 N Bogan Rd
- 4481 Bogan Gates Trail
- 3445 Lake Seminole Dr
- 3745 Lake Seminole Dr
- 4637 Landing Water Path
- 3805 Jones Creek Dr
- 5165 Sycamore Trail Unit 285
- 5165 Sycamore Trail
- 3271 Meadow Lily Ct
- 3032 Seneca Farm Ln
- 3895 Old Friendship Rd NE
- 4653 Whispering Pines
- 4653 Whispering Pines Unit 449
- 3236 Copper Creek Ln NE
- 3345 Stoneleigh Run Dr
- 3340 Ivey Ridge Rd
- 3311 Burkston Place
- 4034 Dantry Ln
- Sumner Plan at Oakmead
- Essex Plan at Oakmead
- 4091 Muddy River Ln
- 4097 Muddy River Ln
- 4085 Muddy River Ln
- 4397 Chatuge Dr
- 4042 Nick A Jack Cove
- 4092 Muddy River Ln
- 4098 Muddy River Ln
- 4086 Muddy River Ln
- 4080 Muddy River Ln
- 0 Muddy River Ln Unit 9026673
- 0 Muddy River Ln Unit 8781984
- 0 Muddy River Ln Unit 7302333
- 0 Nick-A-jack Cove
- 4398 Chatuge Dr
- 4404 Chatuge Dr
- 4048 Nick A Jack Cove
- 4392 Chatuge Dr
- 4419 Chatuge Dr
- 4416 Chatuge Dr
- 4035 Nick A Jack Cove