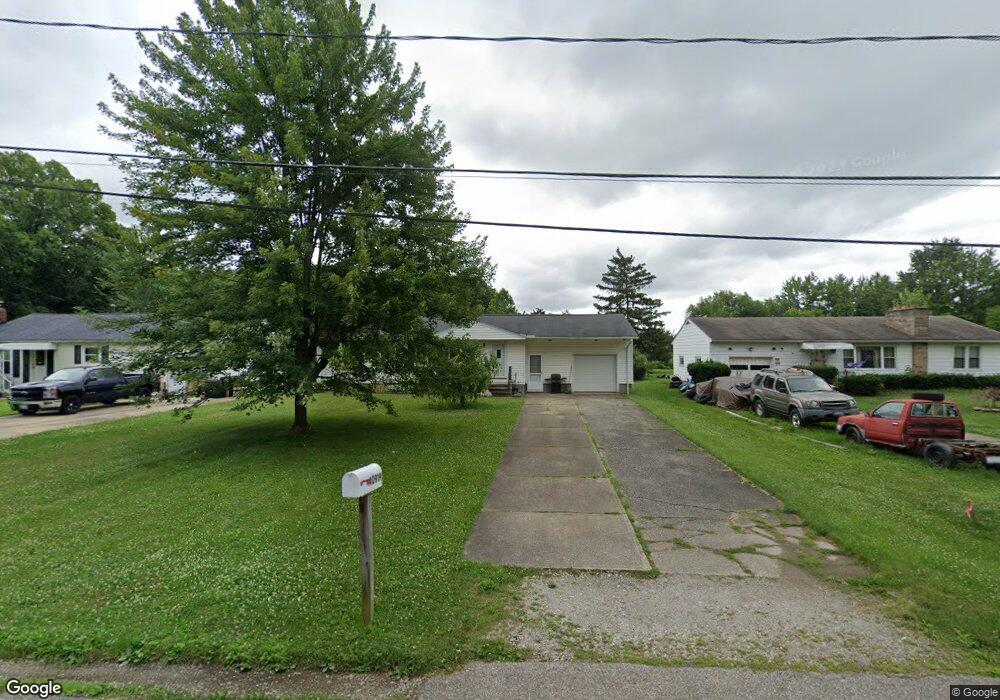
40919 Myrtle Ct Elyria, OH 44035
Estimated Value: $131,971 - $168,000
2
Beds
1
Bath
1,092
Sq Ft
$142/Sq Ft
Est. Value
About This Home
This home is located at 40919 Myrtle Ct, Elyria, OH 44035 and is currently estimated at $154,993, approximately $141 per square foot. 40919 Myrtle Ct is a home located in Lorain County with nearby schools including Midview West Elementary School, Midview North Elementary School, and Midview Middle School.
Ownership History
Date
Name
Owned For
Owner Type
Purchase Details
Closed on
Feb 1, 2010
Sold by
Fannie Mae
Bought by
Woodards Ryan M and Blaylock Alisha F
Current Estimated Value
Home Financials for this Owner
Home Financials are based on the most recent Mortgage that was taken out on this home.
Original Mortgage
$64,331
Outstanding Balance
$42,746
Interest Rate
5.11%
Mortgage Type
FHA
Estimated Equity
$112,247
Purchase Details
Closed on
Sep 25, 2009
Sold by
Glenn Donald D and Glenn Beverly J
Bought by
Federal National Mortgage Association
Purchase Details
Closed on
Feb 10, 1999
Sold by
Brown Arthur L
Bought by
Glenn Donald D and Glenn Beverley J
Home Financials for this Owner
Home Financials are based on the most recent Mortgage that was taken out on this home.
Original Mortgage
$92,820
Interest Rate
6.92%
Mortgage Type
VA
Create a Home Valuation Report for This Property
The Home Valuation Report is an in-depth analysis detailing your home's value as well as a comparison with similar homes in the area
Home Values in the Area
Average Home Value in this Area
Purchase History
| Date | Buyer | Sale Price | Title Company |
|---|---|---|---|
| Woodards Ryan M | $65,000 | Accutitle Agency Inc | |
| Federal National Mortgage Association | $75,000 | None Available | |
| Glenn Donald D | $91,000 | Lorain County Title Co Inc |
Source: Public Records
Mortgage History
| Date | Status | Borrower | Loan Amount |
|---|---|---|---|
| Open | Woodards Ryan M | $64,331 | |
| Previous Owner | Glenn Donald D | $92,820 |
Source: Public Records
Tax History
| Year | Tax Paid | Tax Assessment Tax Assessment Total Assessment is a certain percentage of the fair market value that is determined by local assessors to be the total taxable value of land and additions on the property. | Land | Improvement |
|---|---|---|---|---|
| 2024 | $2,048 | $40,079 | $8,159 | $31,920 |
| 2023 | $1,513 | $27,748 | $3,574 | $24,175 |
| 2022 | $1,426 | $27,748 | $3,574 | $24,175 |
| 2021 | $1,428 | $27,748 | $3,574 | $24,175 |
| 2020 | $1,388 | $25,320 | $3,260 | $22,060 |
| 2019 | $1,383 | $25,320 | $3,260 | $22,060 |
| 2018 | $1,397 | $25,320 | $3,260 | $22,060 |
| 2017 | $1,573 | $26,390 | $3,260 | $23,130 |
| 2016 | $1,594 | $26,390 | $3,260 | $23,130 |
| 2015 | $1,580 | $26,390 | $3,260 | $23,130 |
| 2014 | $1,577 | $26,390 | $3,260 | $23,130 |
| 2013 | $1,579 | $26,160 | $3,260 | $22,900 |
Source: Public Records
Map
Nearby Homes
- 114 River Run Dr
- 221 River Run Dr
- 229 River Run Dr
- 238 Leather Leaf Dr
- 218 Leather Leaf Dr
- 1920 Middle Ave
- 250 Leather Leaf Dr
- 2025 Scott Ct
- 413 Pheasant Run
- 421 Pheasant Run
- 437 Pheasant Run
- 502 Cedarwood Trail
- 414 Pheasant Run
- 426 Pheasant Run
- 430 Pheasant Run
- 229 Harvest Way
- 338 17th St
- 1716 Middle Ave
- 234 Oakwood St
- 319 17th St
- 40907 Myrtle Ct
- 40935 Myrtle Ct
- 40945 Myrtle Ct
- 40869 Myrtle Ct
- 40920 Myrtle Ct
- 40936 Myrtle Ct
- 10511 Lagrange Rd
- 10483 Lagrange Rd
- 40878 Myrtle Ct
- 10451 Lagrange Rd
- 706 Oberlin Elyria Rd
- 120 Wanda St
- 120 Wanda St
- 702 Oberlin Elyria Rd
- 700 Oberlin Elyria Rd
- 10464 Lagrange Rd
- 10506 Lagrange Rd
- 135 Wanda St
- 680 Oberlin Elyria Rd
- 780 Oberlin-Elyria Rd A 3
Your Personal Tour Guide
Ask me questions while you tour the home.