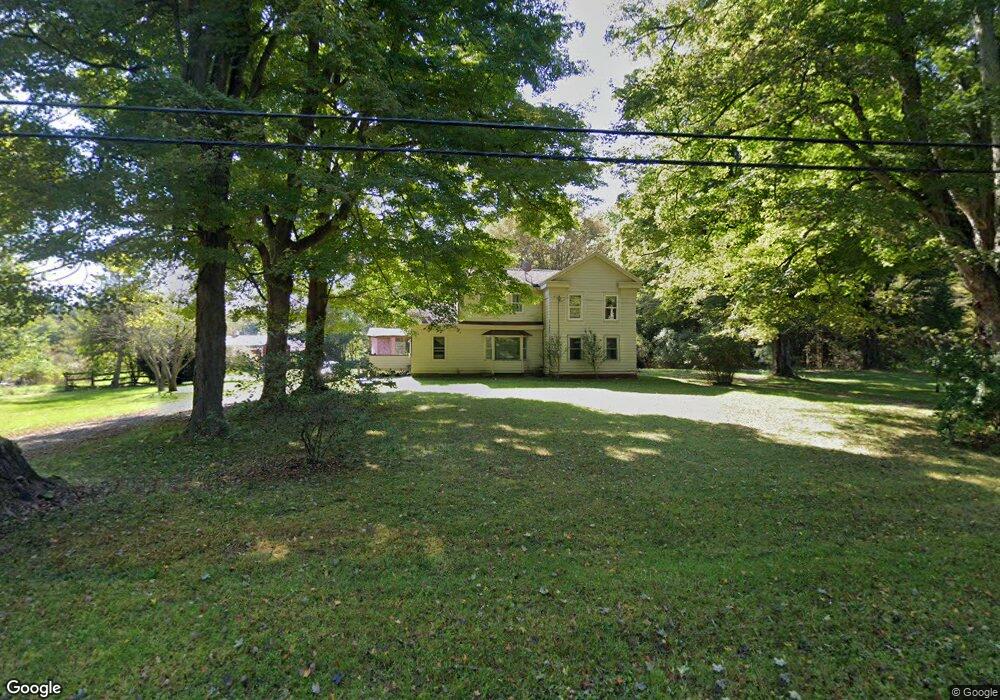
40919 Paw Paw Rd Paw Paw, MI 49079
Estimated Value: $283,000 - $361,000
4
Beds
2
Baths
2,187
Sq Ft
$147/Sq Ft
Est. Value
About This Home
This home is located at 40919 Paw Paw Rd, Paw Paw, MI 49079 and is currently estimated at $321,115, approximately $146 per square foot. 40919 Paw Paw Rd is a home located in Van Buren County with nearby schools including Paw Paw Early Elementary School, Paw Paw Later Elementary School, and Paw Paw Middle School.
Ownership History
Date
Name
Owned For
Owner Type
Purchase Details
Closed on
Nov 22, 2024
Sold by
Sparks Christine
Bought by
Sparks Christine and Sparks William Robert
Current Estimated Value
Purchase Details
Closed on
Oct 4, 2024
Sold by
Peterman Patricia and Peterman Patricia Lee
Bought by
Sparks Christine
Purchase Details
Closed on
Mar 28, 2013
Sold by
Fannie Mae
Bought by
Peterman Patricia
Purchase Details
Closed on
Aug 20, 2012
Sold by
Bank Of America Na
Bought by
Federal National Mortgage Association
Purchase Details
Closed on
Jun 28, 2012
Sold by
Mcdaniel Cheryl
Bought by
Bank Of America Na
Purchase Details
Closed on
Sep 22, 1998
Sold by
Dean William A and Dean Christiane
Bought by
Mcdaniel Cheryl and Mcdaniel Stevie
Purchase Details
Closed on
Jul 15, 1997
Sold by
Bonnema Chalres W and Bonnema Cheryl A
Bought by
Dean William and Dean Christiane
Purchase Details
Closed on
Jan 4, 1996
Sold by
Reisterer Thomas H
Bought by
Bonnema Charles W
Create a Home Valuation Report for This Property
The Home Valuation Report is an in-depth analysis detailing your home's value as well as a comparison with similar homes in the area
Home Values in the Area
Average Home Value in this Area
Purchase History
| Date | Buyer | Sale Price | Title Company |
|---|---|---|---|
| Sparks Christine | -- | None Listed On Document | |
| Sparks Christine | -- | None Listed On Document | |
| Peterman Patricia | $78,000 | None Available | |
| Federal National Mortgage Association | -- | None Available | |
| Bank Of America Na | $149,054 | None Available | |
| Mcdaniel Cheryl | $128,000 | -- | |
| Dean William | $125,000 | -- | |
| Bonnema Charles W | $90,500 | -- |
Source: Public Records
Tax History Compared to Growth
Tax History
| Year | Tax Paid | Tax Assessment Tax Assessment Total Assessment is a certain percentage of the fair market value that is determined by local assessors to be the total taxable value of land and additions on the property. | Land | Improvement |
|---|---|---|---|---|
| 2025 | $3,093 | $161,600 | $0 | $0 |
| 2024 | $935 | $138,100 | $0 | $0 |
| 2023 | $891 | $120,600 | $0 | $0 |
| 2022 | $2,829 | $108,500 | $0 | $0 |
| 2021 | $2,743 | $106,000 | $18,800 | $87,200 |
| 2020 | $836 | $106,600 | $18,800 | $87,800 |
| 2019 | $3,798 | $99,400 | $31,500 | $67,900 |
| 2018 | $2,370 | $112,100 | $39,800 | $72,300 |
| 2017 | $2,304 | $71,500 | $7,500 | $64,000 |
| 2016 | $2,315 | $71,500 | $7,500 | $64,000 |
| 2015 | $2,133 | $71,500 | $7,500 | $64,000 |
| 2014 | $2,109 | $71,010 | $0 | $0 |
| 2013 | -- | $70,800 | $17,900 | $52,900 |
Source: Public Records
Map
Nearby Homes
- 43618 Carla Dr
- 43834 Eagle Lake Dr
- 0 Palmer Dr
- 0 70th Ave
- 38126 72nd Ave Unit b
- 38126 72nd Ave
- 58356 Cr 671
- 44850 Woodman Dr
- 73541 39th St
- 37111 Paw Rd
- 1 Kasper Dr
- 35499 County Road 358
- 38347 County Road 374
- 60846 N Lakeshore Dr
- 44702 B 56th Ave
- 600 W Michigan Ave
- 77199 M-51
- 1 Cr 665
- 58797 Territorial Rd
- 406 Lake Blvd