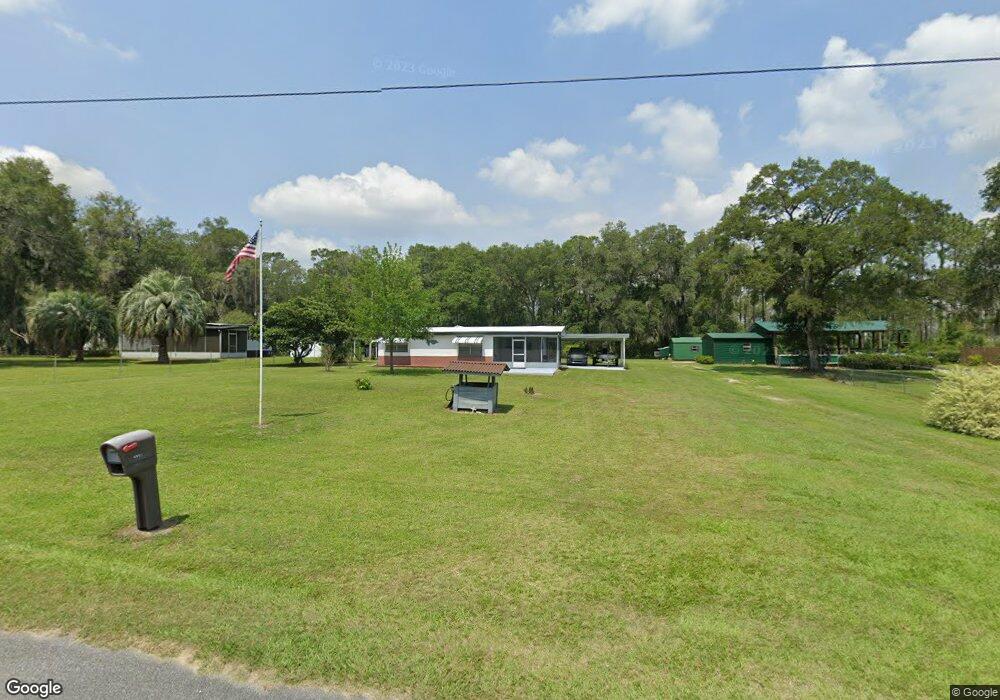
4092 S Frost Point Inverness, FL 34452
Estimated Value: $134,000 - $233,000
2
Beds
2
Baths
1,160
Sq Ft
$145/Sq Ft
Est. Value
About This Home
This home is located at 4092 S Frost Point, Inverness, FL 34452 and is currently estimated at $167,667, approximately $144 per square foot. 4092 S Frost Point is a home located in Citrus County with nearby schools including Pleasant Grove Elementary School, Inverness Middle School, and Citrus High School.
Ownership History
Date
Name
Owned For
Owner Type
Purchase Details
Closed on
Mar 20, 2023
Sold by
Holliday Catherine and Holliday Mark
Bought by
Romish David W and Romish Patricia A
Current Estimated Value
Purchase Details
Closed on
Feb 5, 2018
Sold by
Rood Mary
Bought by
Holliday Catherine and Holliday Mark
Purchase Details
Closed on
Nov 3, 2017
Sold by
Rood Mary
Bought by
Holliday Catherine and Holliday Mark
Purchase Details
Closed on
Feb 10, 2011
Sold by
Romish David W and Romish Patricia A
Bought by
Rood Mary and Rood Ronnie
Purchase Details
Closed on
Dec 1, 2010
Sold by
Rood Mary B and Rood Ronnie
Bought by
Romish David W and Romish Patricia A
Purchase Details
Closed on
Nov 1, 1999
Bought by
Rood Mary and Rood Ronnie Rood
Purchase Details
Closed on
Sep 1, 1998
Bought by
Rood Mary and Rood Ronnie Rood
Purchase Details
Closed on
May 1, 1993
Bought by
Rood Mary and Rood Ronnie Rood
Purchase Details
Closed on
Aug 1, 1985
Bought by
Rood Mary and Rood Ronnie Rood
Create a Home Valuation Report for This Property
The Home Valuation Report is an in-depth analysis detailing your home's value as well as a comparison with similar homes in the area
Home Values in the Area
Average Home Value in this Area
Purchase History
| Date | Buyer | Sale Price | Title Company |
|---|---|---|---|
| Romish David W | $100 | -- | |
| Holliday Catherine | -- | Attorney | |
| Holliday Catherine | -- | None Available | |
| Rood Mary | -- | None Available | |
| Romish David W | -- | Attorney | |
| Rood Mary | $100 | -- | |
| Rood Mary | $51,000 | -- | |
| Rood Mary | $100 | -- | |
| Rood Mary | $35,500 | -- |
Source: Public Records
Tax History Compared to Growth
Tax History
| Year | Tax Paid | Tax Assessment Tax Assessment Total Assessment is a certain percentage of the fair market value that is determined by local assessors to be the total taxable value of land and additions on the property. | Land | Improvement |
|---|---|---|---|---|
| 2025 | $1,734 | $127,350 | $7,500 | $119,850 |
| 2024 | $1,648 | $116,550 | $3,300 | $113,250 |
| 2023 | $1,648 | $93,509 | $0 | $0 |
| 2022 | $1,422 | $95,860 | $4,160 | $91,700 |
| 2021 | $1,238 | $77,280 | $3,910 | $73,370 |
| 2020 | $389 | $74,150 | $3,910 | $70,240 |
| 2019 | $378 | $63,090 | $3,910 | $59,180 |
| 2018 | $337 | $52,260 | $3,910 | $48,350 |
| 2017 | $329 | $41,734 | $3,910 | $37,824 |
| 2016 | $326 | $40,876 | $3,910 | $36,966 |
| 2015 | $322 | $40,592 | $4,900 | $35,692 |
| 2014 | $326 | $40,270 | $5,045 | $35,225 |
Source: Public Records
Map
Nearby Homes
- 4175 S Illiana Terrace
- 4265 S Illiana Terrace
- 4375 E Archer Ln
- 4801 E Doeskin Loop
- 4823 E Bow N Arrow Loop
- 4975 E Triss St
- 5425 E Arbor St
- 828 Great Pine Point
- 5191 E Anna Jo Dr
- 5306 E Hopp Ln
- 5106 E Lambert Ln
- 4075 S Alpine Ave
- 5848 E Aloha St
- 3627 S Fitch Ave
- 5060 E Backner Ln
- 6046 E Loring Ln
- 5144 E Backner Ln
- 6080 E Elgin Ln
- 6079 E King Ln
- 6015 E Dell Ln
- 4070 S Frost Point
- 4081 S Illiana Terrace
- 4125 S Illiana Terrace
- 4309 E Mccartney Loop
- 4208 S Frost Point
- 4145 S Illiana Terrace
- 4301 E Mccartney Loop
- 4209 S Frost Point
- 4300 E Mccartney Loop
- 4319 E Mccartney Loop
- 4204 S Illiana Terrace
- 4309 E Trail X
- 4309 E Trail X
- 4229 S Frost Point
- 4309 4309 Trail X
- 4187 S Illiana Terrace
- 4208 E Mccartney Loop
- 4320 E Trail X
- 0 E Trail X