Estimated Value: $414,709 - $444,000
3
Beds
2
Baths
1,380
Sq Ft
$311/Sq Ft
Est. Value
About This Home
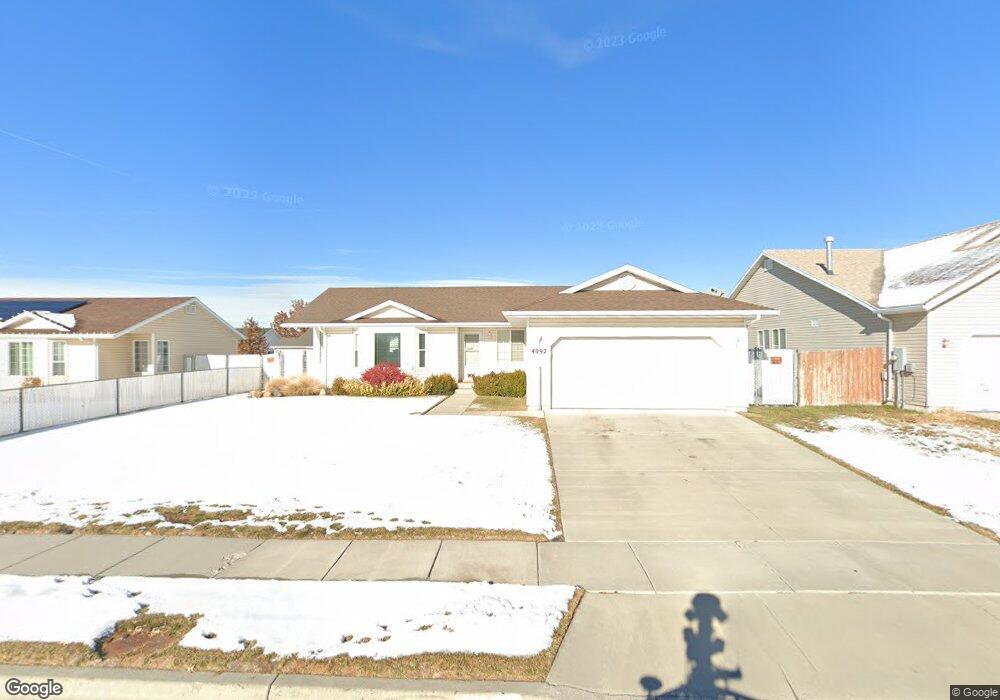
This home is located at 4092 W 5250 S, Roy, UT 84067 and is currently estimated at $428,927, approximately $310 per square foot. 4092 W 5250 S is a home located in Weber County with nearby schools including Country View School, Rocky Mountain Junior High School, and Roy High School.
Ownership History
Date
Name
Owned For
Owner Type
Purchase Details
Closed on
Aug 9, 2022
Sold by
Robbins Donald R
Bought by
Robbins Family Revocable Trust
Current Estimated Value
Purchase Details
Closed on
Aug 27, 2009
Sold by
Helton Robin J
Bought by
Robbins Donald R and Robbins Nola J
Home Financials for this Owner
Home Financials are based on the most recent Mortgage that was taken out on this home.
Original Mortgage
$50,000
Interest Rate
4.57%
Mortgage Type
New Conventional
Purchase Details
Closed on
Aug 5, 2004
Sold by
Hansen Robert S and Hansen Sheri L
Bought by
Marshall James H and Marshall Nancy L
Purchase Details
Closed on
Aug 31, 1999
Sold by
Alpine Homes Inc
Bought by
Hansen Robert S and Hansen Sheri L
Home Financials for this Owner
Home Financials are based on the most recent Mortgage that was taken out on this home.
Original Mortgage
$118,473
Interest Rate
7.47%
Mortgage Type
FHA
Create a Home Valuation Report for This Property
The Home Valuation Report is an in-depth analysis detailing your home's value as well as a comparison with similar homes in the area
Home Values in the Area
Average Home Value in this Area
Purchase History
| Date | Buyer | Sale Price | Title Company |
|---|---|---|---|
| Robbins Family Revocable Trust | -- | -- | |
| Robbins Donald R | -- | Backman Ntp | |
| Marshall James H | -- | Backman Stewart Title | |
| Hansen Robert S | -- | First American Title |
Source: Public Records
Mortgage History
| Date | Status | Borrower | Loan Amount |
|---|---|---|---|
| Previous Owner | Robbins Donald R | $50,000 | |
| Previous Owner | Hansen Robert S | $118,473 |
Source: Public Records
Tax History Compared to Growth
Tax History
| Year | Tax Paid | Tax Assessment Tax Assessment Total Assessment is a certain percentage of the fair market value that is determined by local assessors to be the total taxable value of land and additions on the property. | Land | Improvement |
|---|---|---|---|---|
| 2025 | $2,571 | $406,846 | $125,007 | $281,839 |
| 2024 | $2,488 | $217,799 | $68,753 | $149,046 |
| 2023 | $2,515 | $221,650 | $65,864 | $155,786 |
| 2022 | $2,578 | $234,300 | $57,758 | $176,542 |
| 2021 | $2,022 | $300,000 | $79,963 | $220,037 |
| 2020 | $1,967 | $269,000 | $79,963 | $189,037 |
| 2019 | $1,869 | $240,000 | $44,976 | $195,024 |
| 2018 | $1,781 | $215,000 | $42,041 | $172,959 |
| 2017 | $1,643 | $185,000 | $42,041 | $142,959 |
| 2016 | $1,595 | $96,618 | $21,944 | $74,674 |
| 2015 | $1,413 | $86,873 | $21,944 | $64,929 |
| 2014 | $1,352 | $81,774 | $19,237 | $62,537 |
Source: Public Records
Map
Nearby Homes
- 5270 S 4200 W
- 4218 W 5050 S
- 5013 S 4150 W
- 4021 W 5000 S
- 5235 Midland Dr
- 4990 S 4075 W
- 5116 S 4300 W
- 4890 S 4075 W
- 4141 W 4875 S
- 5465 S 4050 W
- 4106 W 4875 S
- 4337 W 5430 S Unit A
- 4342 W 5430 S Unit B
- 4309 W 5430 St #B S
- 3820 Foxglen Dr
- 3766 W 5300 S
- 5539 S 4175 W
- 4449 W 5325 S
- 4097 W 4750 S
- 4756 S 4300 W
- 4086 W 5250 S
- 4086 W 5250 S Unit 21
- 4108 W 5250 S
- 4108 W 5250 S Unit 19
- 4113 W 5075 S
- 4127 W 5075 S
- 4109 W 5075 S
- 4114 W 5250 S
- 4114 W 5250 S Unit 18
- 4070 W 5250 S
- 4139 W 5075 S
- 4091 W 5250 S
- 4091 W 5250 S Unit 48
- 4087 W 5250 S
- 4103 W 5250 S
- 4143 W 5075 S
- 4122 W 5250 S
- 4122 W 5250 S Unit 17
- 4067 W 5250 S
- 4064 W 5250 S