
Landlord's Agent in 2022
Hemanth Grandhige
Wynd Realty Georgia
(503) 734-6174
1 Total Sale
Estimated Value: $370,303 - $392,000
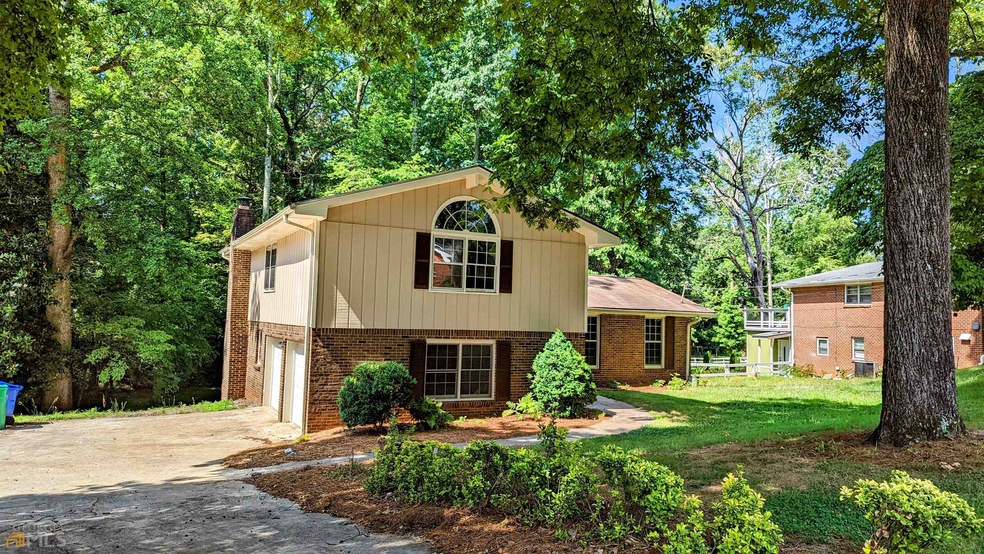
Beatifully remodeled and updated split level home. Great location in Tucker, easy access to Emory, CDC, I-285. Quick access to Main St Tucker and restaurants. This property has just undergone a beautiful remodel, new carpets, new tile, new appliances, new countertops, new light fixtures, and painted top to bottom. This split level home has a separate dining room adjoining the kitchen for easy family dinners. Large formal living room. Sunken family room opens to large back deck, and lush back yard. Peaceful creek at the back of the lot! 2 car garage and a large driveway for ample parking. Master bedroom with a walk-in closet. All bedrooms are large and full of natural light. This home is a gem and in great Tucker school districts. Pets up to 45 lbs allowed with a non-reimbursable pet fee.
Last Agent to Rent the Property
Wynd Realty Georgia License #362132 Listed on: 06/13/2022
| Date | Buyer | Sale Price | Title Company |
|---|---|---|---|
| Havn Real Estate Llc | $75,487 | -- |
| Date | Status | Borrower | Loan Amount |
|---|---|---|---|
| Open | Havn Real Estate Llc | $67,938 |
| Date | Event | Price | List to Sale | Price per Sq Ft |
|---|---|---|---|---|
| 07/20/2022 07/20/22 | Rented | $2,450 | 0.0% | -- |
| 06/29/2022 06/29/22 | Price Changed | $2,450 | -10.9% | $1 / Sq Ft |
| 06/13/2022 06/13/22 | For Rent | $2,750 | +112.4% | -- |
| 09/29/2015 09/29/15 | Rented | $1,295 | 0.0% | -- |
| 09/29/2015 09/29/15 | For Rent | $1,295 | -- | -- |
| Year | Tax Paid | Tax Assessment Tax Assessment Total Assessment is a certain percentage of the fair market value that is determined by local assessors to be the total taxable value of land and additions on the property. | Land | Improvement |
|---|---|---|---|---|
| 2025 | $7,086 | $147,160 | $31,680 | $115,480 |
| 2024 | $5,668 | $117,240 | $31,680 | $85,560 |
| 2023 | $5,668 | $72,880 | $25,508 | $47,372 |
| 2022 | $3,520 | $72,880 | $25,508 | $47,372 |
| 2021 | $2,285 | $72,880 | $25,760 | $47,120 |
| 2020 | $2,261 | $43,840 | $14,160 | $29,680 |
| 2019 | $2,800 | $56,240 | $14,160 | $42,080 |
| 2018 | $2,093 | $45,520 | $17,160 | $28,360 |
| 2017 | $2,066 | $37,880 | $17,160 | $20,720 |
| 2016 | $1,735 | $31,400 | $17,160 | $14,240 |
| 2014 | $1,860 | $33,400 | $17,160 | $16,240 |
Landlord's Agent in 2022
Hemanth Grandhige
Wynd Realty Georgia
(503) 734-6174
1 Total Sale
Seller's Agent in 2015
Tracy Minich
RE/MAX
(404) 312-1078
13 in this area
90 Total Sales
Buyer's Agent in 2015
Glenda Broker
Non-Mls Company
(800) 289-1214
Source: Georgia MLS
MLS Number: 20049216
APN: 18-141-02-121
Disclaimer: Certain information contained herein is derived from information provided by parties other than Homes.com. All information provided is deemed reliable, but is not guaranteed to be accurate and should be independently verified.
![]() The data relating to real estate for sale on this web site comes in part from the Broker Reciprocity Program of Georgia MLS. Real estate listings held by brokerage firms other than Redfin are marked with the Broker Reciprocity logo and detailed information about them includes the name of the listing brokers. Information deemed reliable but not guaranteed. Copyright 2025 Georgia MLS. All rights reserved.
The data relating to real estate for sale on this web site comes in part from the Broker Reciprocity Program of Georgia MLS. Real estate listings held by brokerage firms other than Redfin are marked with the Broker Reciprocity logo and detailed information about them includes the name of the listing brokers. Information deemed reliable but not guaranteed. Copyright 2025 Georgia MLS. All rights reserved.