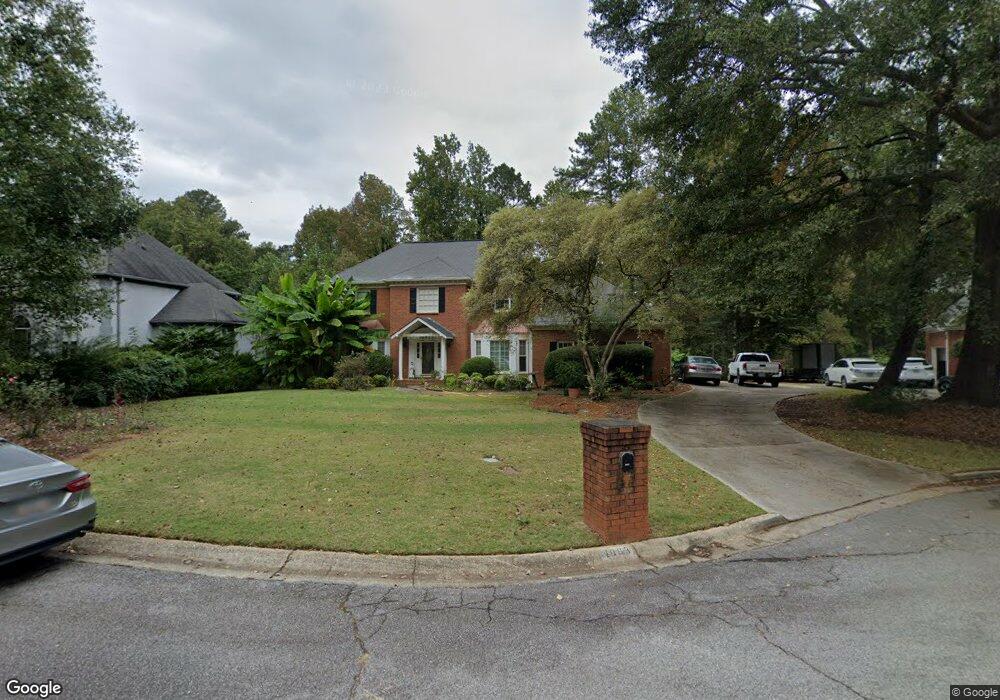
4093 Palace Ct SW Unit 1 Lilburn, GA 30047
Estimated Value: $507,000 - $528,000
4
Beds
3
Baths
3,382
Sq Ft
$152/Sq Ft
Est. Value
About This Home
This home is located at 4093 Palace Ct SW Unit 1, Lilburn, GA 30047 and is currently estimated at $513,219, approximately $151 per square foot. 4093 Palace Ct SW Unit 1 is a home located in Gwinnett County with nearby schools including Knight Elementary School, Trickum Middle School, and Parkview High School.
Ownership History
Date
Name
Owned For
Owner Type
Purchase Details
Closed on
Jun 11, 2019
Sold by
Jacob Annamma
Bought by
Jacob Annamma and Jacob Ranjan Perumanajakuzhi
Current Estimated Value
Purchase Details
Closed on
Sep 28, 2004
Sold by
Lucisano Robert and Lucisano Katrina
Bought by
Jacob Annamma
Home Financials for this Owner
Home Financials are based on the most recent Mortgage that was taken out on this home.
Original Mortgage
$61,800
Interest Rate
5.16%
Mortgage Type
Unknown
Purchase Details
Closed on
Jun 28, 2002
Sold by
Lucisano Katrina M
Bought by
Lucisano Robert and Lucisano Katrina M
Home Financials for this Owner
Home Financials are based on the most recent Mortgage that was taken out on this home.
Original Mortgage
$236,000
Interest Rate
6.79%
Mortgage Type
New Conventional
Purchase Details
Closed on
Feb 28, 1997
Sold by
Maguire John T Carla C
Bought by
Lucisano Katrina M
Create a Home Valuation Report for This Property
The Home Valuation Report is an in-depth analysis detailing your home's value as well as a comparison with similar homes in the area
Home Values in the Area
Average Home Value in this Area
Purchase History
| Date | Buyer | Sale Price | Title Company |
|---|---|---|---|
| Jacob Annamma | -- | -- | |
| Jacob Annamma | $309,000 | -- | |
| Lucisano Robert | -- | -- | |
| Lucisano Katrina M | $239,900 | -- |
Source: Public Records
Mortgage History
| Date | Status | Borrower | Loan Amount |
|---|---|---|---|
| Previous Owner | Jacob Annamma | $61,800 | |
| Previous Owner | Jacob Annamma | $247,200 | |
| Previous Owner | Lucisano Robert | $236,000 | |
| Closed | Lucisano Katrina M | $0 |
Source: Public Records
Tax History Compared to Growth
Tax History
| Year | Tax Paid | Tax Assessment Tax Assessment Total Assessment is a certain percentage of the fair market value that is determined by local assessors to be the total taxable value of land and additions on the property. | Land | Improvement |
|---|---|---|---|---|
| 2025 | $1,752 | $209,920 | $36,000 | $173,920 |
| 2024 | $1,746 | $211,960 | $36,000 | $175,960 |
| 2023 | $1,746 | $191,400 | $32,000 | $159,400 |
| 2022 | $1,707 | $169,960 | $32,000 | $137,960 |
| 2021 | $1,691 | $132,680 | $26,800 | $105,880 |
| 2020 | $1,689 | $130,160 | $24,000 | $106,160 |
| 2019 | $4,126 | $120,400 | $24,000 | $96,400 |
| 2018 | $3,919 | $110,600 | $20,000 | $90,600 |
| 2016 | $3,135 | $84,320 | $24,000 | $60,320 |
| 2015 | $3,161 | $84,320 | $24,000 | $60,320 |
| 2014 | $2,674 | $71,672 | $20,400 | $51,272 |
Source: Public Records
Map
Nearby Homes
- 312 Westminister Ln SW
- 156 Round Pond Dr
- 234 Shadow Lake Dr SW
- 246 Round Pond Dr
- 4239 River Branch Way
- 453 James St SW
- 445 Bruce Way SW
- 478 Dorsey Cir SW
- 383 Ben Ave SW
- 565 James St SW Unit 10
- 4358 Louis Rd SW
- 3900 Safehaven Dr
- Oxford Plan at The Preserve at Killian Hill - Townhomes
- 287 Willow Cove Ct
- 551 Killian Hill Rd SW
- 3730 Willow Mill Dr
- 167 Lester Rd SW Unit 1
- 676 Killian Hill Rd SW
- 4103 Palace Ct SW
- 4083 Palace Ct SW
- 4102 Palace Ct SW
- 4073 Palace Ct SW Unit 1
- 333 Westminister Ln SW
- 282 N River Dr SW
- 323 Westminister Ln SW
- 4092 Palace Ct SW
- 313 Westminister Ln SW
- 252 N River Dr SW
- 4125 Regent Ln SW
- 352 Westminister Ln SW
- 353 Westminister Ln SW Unit 1
- 261 N River Dr SW
- 271 N River Dr SW Unit 2
- 4136 Regent Ln SW
- 302 N River Dr SW Unit 1
- 362 Westminister Ln SW
- 383 Westminister Ln SW
- 281 N River Dr SW