4094 N 1000 W Thorntown, IN 46071
Estimated Value: $882,000 - $1,054,440
2
Beds
2
Baths
2,300
Sq Ft
$422/Sq Ft
Est. Value
About This Home
This home is located at 4094 N 1000 W, Thorntown, IN 46071 and is currently estimated at $970,610, approximately $422 per square foot. 4094 N 1000 W is a home located in Boone County with nearby schools including Western Boone Junior/Senior High School.
Ownership History
Date
Name
Owned For
Owner Type
Purchase Details
Closed on
Jan 6, 2006
Sold by
Duncan Weinmann K and Duncan Juanita
Bought by
Rice Daniel K and Rice Lorrie Miller
Current Estimated Value
Home Financials for this Owner
Home Financials are based on the most recent Mortgage that was taken out on this home.
Original Mortgage
$350,000
Outstanding Balance
$196,409
Interest Rate
6.34%
Mortgage Type
New Conventional
Estimated Equity
$774,201
Create a Home Valuation Report for This Property
The Home Valuation Report is an in-depth analysis detailing your home's value as well as a comparison with similar homes in the area
Home Values in the Area
Average Home Value in this Area
Purchase History
| Date | Buyer | Sale Price | Title Company |
|---|---|---|---|
| Rice Daniel K | -- | -- |
Source: Public Records
Mortgage History
| Date | Status | Borrower | Loan Amount |
|---|---|---|---|
| Open | Rice Daniel K | $350,000 |
Source: Public Records
Tax History Compared to Growth
Tax History
| Year | Tax Paid | Tax Assessment Tax Assessment Total Assessment is a certain percentage of the fair market value that is determined by local assessors to be the total taxable value of land and additions on the property. | Land | Improvement |
|---|---|---|---|---|
| 2025 | $6,424 | $852,600 | $114,000 | $738,600 |
| 2024 | $6,424 | $819,600 | $114,000 | $705,600 |
| 2023 | $6,046 | $730,200 | $113,900 | $616,300 |
| 2022 | $6,195 | $697,300 | $113,700 | $583,600 |
| 2021 | $5,728 | $601,000 | $113,600 | $487,400 |
| 2020 | $5,073 | $545,900 | $96,100 | $449,800 |
| 2019 | $4,946 | $545,300 | $96,200 | $449,100 |
| 2018 | $4,706 | $527,900 | $96,200 | $431,700 |
| 2017 | $4,347 | $502,700 | $96,300 | $406,400 |
| 2016 | $4,159 | $749,900 | $246,100 | $503,800 |
| 2014 | $4,154 | $443,300 | $246,100 | $197,200 |
| 2013 | $4,734 | $444,200 | $246,000 | $198,200 |
Source: Public Records
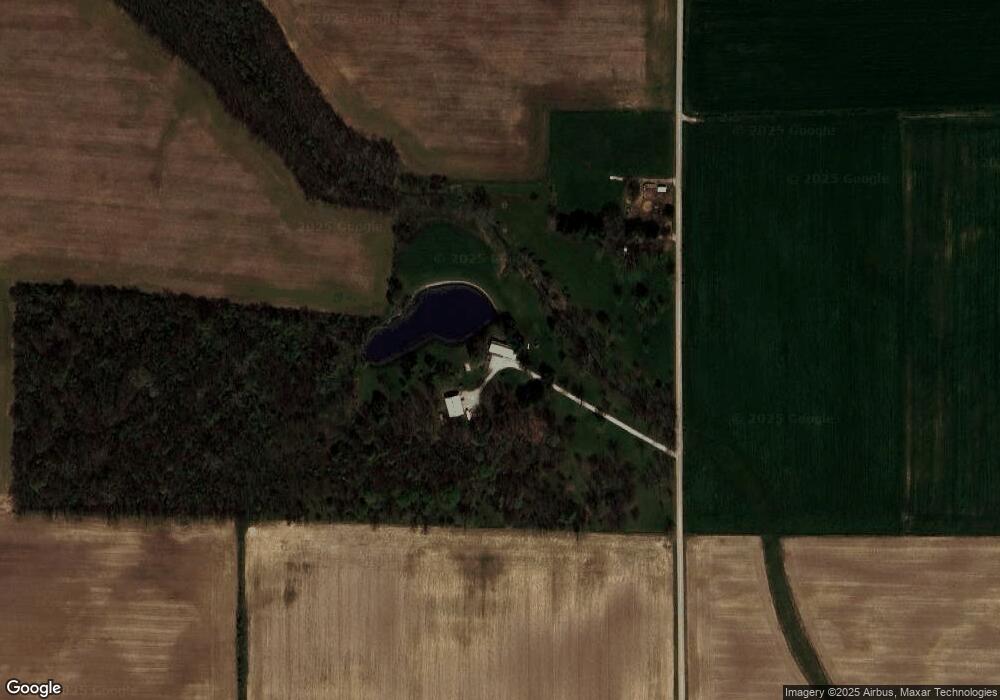
Map
Nearby Homes
- 1321 Locust Place
- 1323 Locust Place
- Juniper Plan at Westfall Place
- Chestnut Plan at Westfall Place
- Walnut Plan at Westfall Place
- Ironwood Plan at Westfall Place
- Empress Plan at Westfall Place
- Ashton Plan at Westfall Place
- Spruce Plan at Westfall Place
- Palmetto Plan at Westfall Place
- Bradford Plan at Westfall Place
- Aspen II Plan at Westfall Place
- Norway Plan at Westfall Place
- Cooper Plan at Westfall Place
- 6139 Westfall Dr
- Ironwood Plan at Northwood Haven
- Spruce Plan at Northwood Haven
- Ashton Plan at Northwood Haven
- Palmetto Plan at Northwood Haven
- Bradford Plan at Northwood Haven