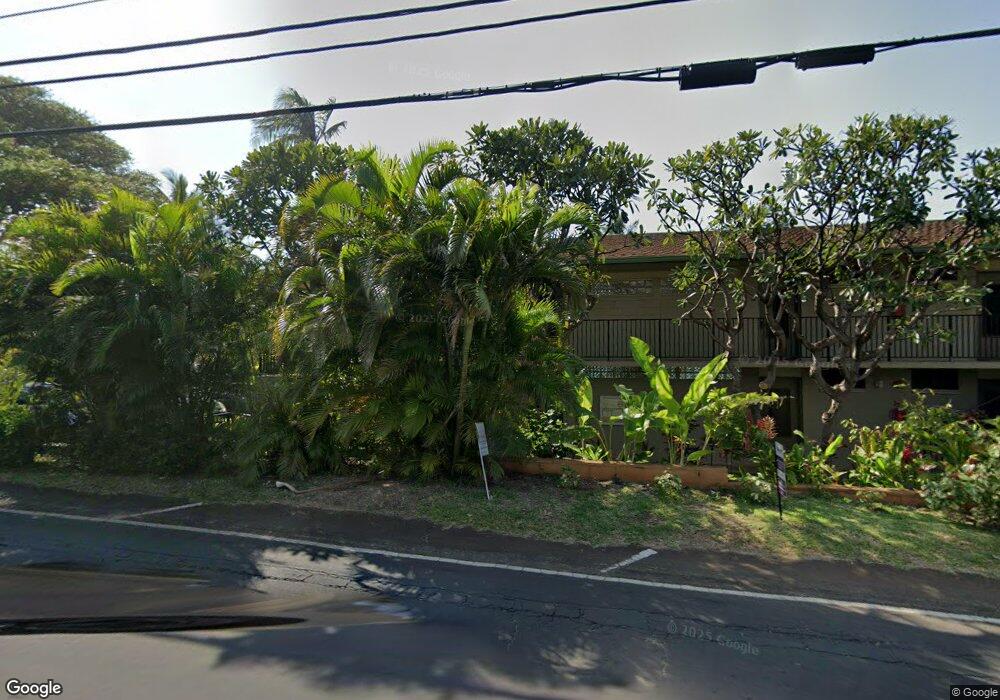
4095 Lower Honoapiilani Rd Unit 210A Lahaina, HI 96761
Estimated Value: $1,221,000 - $2,364,000
2
Beds
2
Baths
62,291
Sq Ft
$25/Sq Ft
Est. Value
About This Home
This home is located at 4095 Lower Honoapiilani Rd Unit 210A, Lahaina, HI 96761 and is currently estimated at $1,556,422, approximately $24 per square foot. 4095 Lower Honoapiilani Rd Unit 210A is a home located in Maui County with nearby schools including King Kamehameha III Elementary School, Lāhainā Intermediate School, and Lahainaluna High School.
Ownership History
Date
Name
Owned For
Owner Type
Purchase Details
Closed on
Nov 27, 2018
Sold by
Roth Amy L
Bought by
Young Arline and The Arline Young Revocable Trust
Current Estimated Value
Home Financials for this Owner
Home Financials are based on the most recent Mortgage that was taken out on this home.
Original Mortgage
$725,000
Outstanding Balance
$638,740
Interest Rate
4.8%
Mortgage Type
New Conventional
Estimated Equity
$917,682
Purchase Details
Closed on
Jun 29, 2006
Sold by
Roth Amy L
Bought by
Roth Amy L and Amy L Roth Trust
Purchase Details
Closed on
Sep 14, 2002
Sold by
Roth Amy L and Webb James R
Bought by
Roth Amy L
Purchase Details
Closed on
Jun 23, 1998
Sold by
Hampton Ruth Dresser and Dresser Mark V
Bought by
Webb James R and Roth Amy L
Home Financials for this Owner
Home Financials are based on the most recent Mortgage that was taken out on this home.
Original Mortgage
$150,000
Interest Rate
7.06%
Create a Home Valuation Report for This Property
The Home Valuation Report is an in-depth analysis detailing your home's value as well as a comparison with similar homes in the area
Home Values in the Area
Average Home Value in this Area
Purchase History
| Date | Buyer | Sale Price | Title Company |
|---|---|---|---|
| Young Arline | $1,225,000 | Fidelity National Title & Es | |
| Roth Amy L | -- | None Available | |
| Roth Amy L | -- | -- | |
| Webb James R | $275,000 | -- |
Source: Public Records
Mortgage History
| Date | Status | Borrower | Loan Amount |
|---|---|---|---|
| Open | Young Arline | $725,000 | |
| Previous Owner | Webb James R | $150,000 |
Source: Public Records
Tax History Compared to Growth
Tax History
| Year | Tax Paid | Tax Assessment Tax Assessment Total Assessment is a certain percentage of the fair market value that is determined by local assessors to be the total taxable value of land and additions on the property. | Land | Improvement |
|---|---|---|---|---|
| 2025 | $19,583 | $1,549,900 | $420,300 | $1,129,600 |
| 2024 | $19,583 | $1,524,700 | $420,300 | $1,104,400 |
| 2023 | $12,522 | $1,181,900 | $420,300 | $761,600 |
| 2022 | $12,522 | $1,056,700 | $211,500 | $845,200 |
| 2021 | $12,230 | $1,099,700 | $192,300 | $907,400 |
| 2020 | $13,104 | $1,182,700 | $192,300 | $990,400 |
| 2019 | $6,981 | $1,106,300 | $174,800 | $931,500 |
| 2018 | $4,634 | $734,400 | $158,900 | $575,500 |
| 2017 | $4,686 | $0 | $0 | $0 |
| 2016 | $472 | $786,100 | $151,000 | $635,100 |
| 2015 | $3,567 | $814,100 | $151,000 | $663,100 |
Source: Public Records
Map
Nearby Homes
- 4095 Lower Honoapiilani Rd Unit 114B
- 4057 Lower Honoapiilani Rd Unit 121
- 4057 Lower Honoapiilani Rd Unit 114
- 4057 Lower Honoapiilani Rd Unit 113
- 11 Piina Place
- 4038 Mahinahina Place
- 54 Piina Place Unit 35
- 4007 Lower Honoapiilani Rd Unit 115
- 4007 Lower Honoapiilani Rd Unit 114
- 3975 Lower Honoapiilani Rd Unit 221
- 4242 Lower Honoapiilani Rd Unit E 210
- 4242 Lower Honoapiilani Rd Unit F-207
- 4242 Lower Honoapiilani Rd Unit F402
- 4242 Lower Honoapiilani Rd Unit F-603
- 3959 Lower Honoapiilani Rd Unit 310
- 3959 Lower Honoapiilani Rd Unit 503
- 3959 Lower Honoapiilani Rd Unit 304
- 4299 Lower Honoapiilani Rd Unit 134
- 4299 Lower Honoapiilani Rd Unit 171
- 4299 Lower Honoapiilani Rd Unit 231
- 4095 Lower Honoapiilani Rd Unit A-302
- 4095 Lower Honoapiilani Rd Unit 119C
- 4095 Lower Honoapiilani Rd Unit 211B
- 4095 Lower Honoapiilani Rd Unit 113
- 4095 Lower Honoapiilani Rd Unit 306A
- 4095 Lower Honoapiilani Rd Unit 115
- 4095 Lower Honoapiilani Rd Unit 304
- 4095 Lower Honoapiilani Rd Unit 410
- 4095 Lower Honoapiilani Rd Unit 109
- 4095 Lower Honoapiilani Rd Unit 101
- 4095 Lower Honoapiilani Rd Unit 305
- 4095 Lower Honoapiilani Rd Unit 106
- 4095 Lower Honoapiilani Rd Unit 213B
- 4095 Lower Honoapiilani Rd Unit 205A
- 4095 Lower Honoapiilani Rd Unit 219C
- 4095 Lower Honoapiilani Rd Unit 212B
- 4095 Lower Honoapiilani Rd Unit 110
- 4095 Lower Honoapiilani Rd Unit 303A
- 4095 Lower Honoapiilani Rd Unit 401
- 4095 Lower Honoapiilani Rd Unit 307