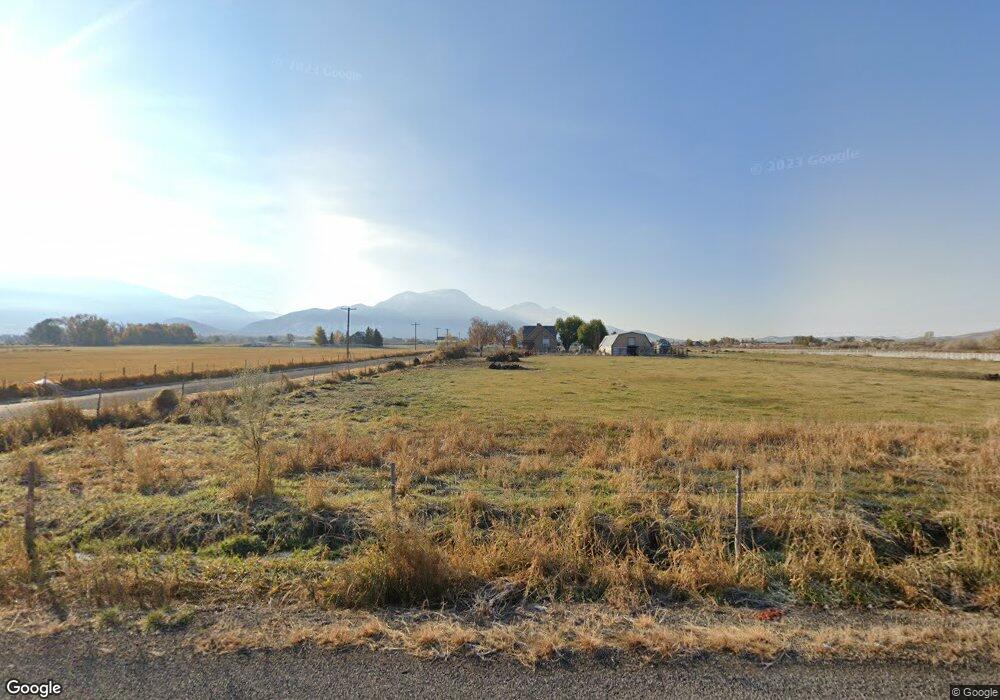
4095 W 9200 S Payson, UT 84651
Estimated Value: $1,008,000 - $1,429,395
5
Beds
4
Baths
3,018
Sq Ft
$418/Sq Ft
Est. Value
About This Home
This home is located at 4095 W 9200 S, Payson, UT 84651 and is currently estimated at $1,261,132, approximately $417 per square foot. 4095 W 9200 S is a home with nearby schools including Taylor Elementary School, Salem Junior High School, and Valley View Middle School.
Ownership History
Date
Name
Owned For
Owner Type
Purchase Details
Closed on
Sep 4, 2020
Sold by
Dial Ian Garth
Bought by
Hollenbeck Dial Patti
Current Estimated Value
Home Financials for this Owner
Home Financials are based on the most recent Mortgage that was taken out on this home.
Original Mortgage
$291,000
Interest Rate
2.9%
Mortgage Type
New Conventional
Purchase Details
Closed on
Feb 22, 2002
Sold by
Hollenbheck Dial Patti and Dial Ian Garth
Bought by
Dial Ian Garth and Hollenbeck Dial Patti
Purchase Details
Closed on
Feb 1, 2002
Sold by
Hollenbheck Dial Patti and Dial Ian Garth
Bought by
Dial Ian Garth and Hollenbeck Dial Patti
Create a Home Valuation Report for This Property
The Home Valuation Report is an in-depth analysis detailing your home's value as well as a comparison with similar homes in the area
Purchase History
| Date | Buyer | Sale Price | Title Company |
|---|---|---|---|
| Hollenbeck Dial Patti | -- | Highland Title | |
| Dial Ian Garth | -- | Provo Land Title Company | |
| Dial Ian Garth | -- | Provo Land Title Company |
Source: Public Records
Mortgage History
| Date | Status | Borrower | Loan Amount |
|---|---|---|---|
| Closed | Hollenbeck Dial Patti | $291,000 |
Source: Public Records
Tax History
| Year | Tax Paid | Tax Assessment Tax Assessment Total Assessment is a certain percentage of the fair market value that is determined by local assessors to be the total taxable value of land and additions on the property. | Land | Improvement |
|---|---|---|---|---|
| 2025 | $6,199 | $674,105 | -- | -- |
| 2024 | $6,199 | $619,665 | $0 | $0 |
| 2023 | $6,146 | $614,880 | $0 | $0 |
| 2022 | $5,719 | $790,000 | $470,400 | $319,600 |
| 2021 | $4,516 | $556,700 | $316,400 | $240,300 |
| 2020 | $3,829 | $448,800 | $273,600 | $175,200 |
| 2019 | $2,981 | $370,400 | $211,100 | $159,300 |
| 2018 | $2,864 | $333,700 | $191,100 | $142,600 |
| 2017 | $2,840 | $220,780 | $0 | $0 |
| 2016 | $2,575 | $194,105 | $0 | $0 |
| 2015 | $2,726 | $203,780 | $0 | $0 |
| 2014 | $2,725 | $203,780 | $0 | $0 |
Source: Public Records
Map
Nearby Homes
- 9284 S 3550 W
- 4050 W 9600 S
- 555 N 500 W Unit 24
- 361 W 625 N Unit A-D
- 383 W 625 N Unit A-D
- 603 900 N
- 451 N 500 W
- 451 N 500 W Unit 39
- 845 W 400 N
- 6300 W 10000 S Unit 2
- 310 N 1500 W
- 823 N 400 W
- 1289 N Bamberger Rd
- 420 N 150 W
- 588 W Utah Ave
- 225 S Majestic Meadows Dr
- 227 S Majestic Meadows Dr
- 323 W 100 S Unit 2
- 574 N 450 E
- 682 N 500 E
Your Personal Tour Guide
Ask me questions while you tour the home.