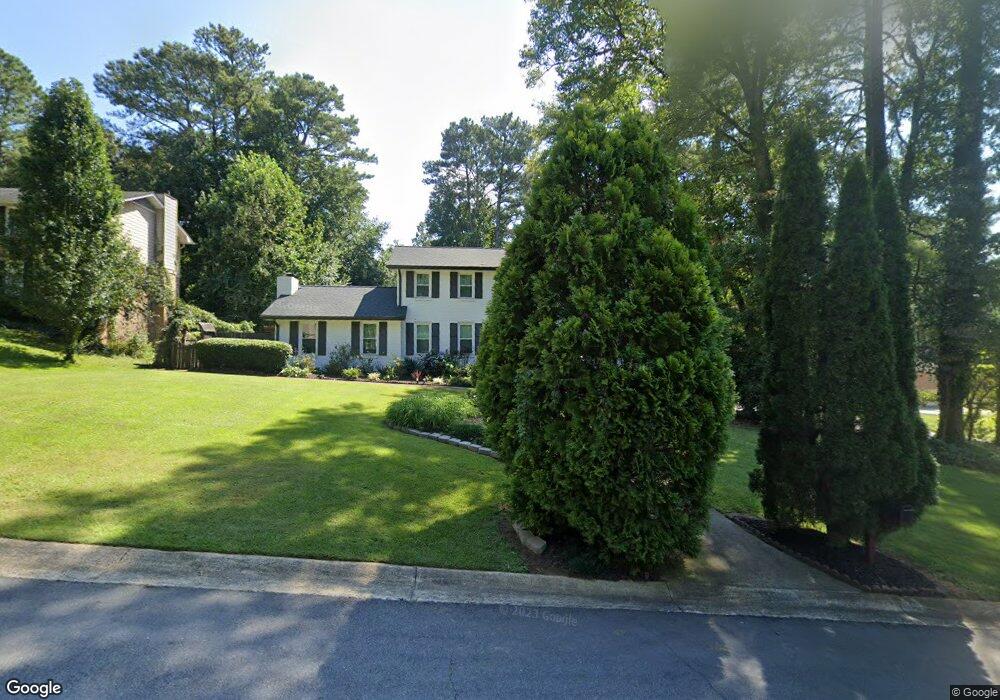
4096 Shady Cir NW Unit 1 Lilburn, GA 30047
Estimated Value: $401,181 - $426,000
4
Beds
3
Baths
2,774
Sq Ft
$149/Sq Ft
Est. Value
About This Home
This home is located at 4096 Shady Cir NW Unit 1, Lilburn, GA 30047 and is currently estimated at $413,295, approximately $148 per square foot. 4096 Shady Cir NW Unit 1 is a home located in Gwinnett County with nearby schools including Minor Elementary School, Berkmar Middle School, and Berkmar High School.
Ownership History
Date
Name
Owned For
Owner Type
Purchase Details
Closed on
Dec 8, 2023
Sold by
Abdurahman Denir Abbas
Bought by
Abdulwahab Tutugn T and Abdurahman Denir A
Current Estimated Value
Purchase Details
Closed on
May 10, 2013
Sold by
Abdurahman Denir Abbas
Bought by
Abdurahman Denir Abbas and Abdulwahab Tutugn Tofik
Purchase Details
Closed on
Mar 20, 2012
Sold by
Yonis Shekib
Bought by
Abdurahman Denir Abbas
Purchase Details
Closed on
Jan 3, 2012
Sold by
Rodriquez Graciela
Bought by
Yonis Shekib
Purchase Details
Closed on
Aug 13, 2004
Sold by
Rodriguez Graciela
Bought by
Rodriguez Graciela
Home Financials for this Owner
Home Financials are based on the most recent Mortgage that was taken out on this home.
Original Mortgage
$198,900
Interest Rate
5.97%
Mortgage Type
New Conventional
Create a Home Valuation Report for This Property
The Home Valuation Report is an in-depth analysis detailing your home's value as well as a comparison with similar homes in the area
Home Values in the Area
Average Home Value in this Area
Purchase History
| Date | Buyer | Sale Price | Title Company |
|---|---|---|---|
| Abdulwahab Tutugn T | -- | -- | |
| Abdurahman Denir Abbas | -- | -- | |
| Abdurahman Denir Abbas | $55,403 | -- | |
| Yonis Shekib | $52,503 | -- | |
| Rodriguez Graciela | -- | -- | |
| Rodriguez Graciela | $198,900 | -- |
Source: Public Records
Mortgage History
| Date | Status | Borrower | Loan Amount |
|---|---|---|---|
| Previous Owner | Rodriguez Graciela | $198,900 |
Source: Public Records
Tax History Compared to Growth
Tax History
| Year | Tax Paid | Tax Assessment Tax Assessment Total Assessment is a certain percentage of the fair market value that is determined by local assessors to be the total taxable value of land and additions on the property. | Land | Improvement |
|---|---|---|---|---|
| 2024 | $4,299 | $165,080 | $21,600 | $143,480 |
| 2023 | $4,299 | $135,200 | $25,600 | $109,600 |
| 2022 | $3,636 | $135,200 | $25,600 | $109,600 |
| 2021 | $3,153 | $109,400 | $18,800 | $90,600 |
| 2020 | $3,122 | $106,800 | $16,800 | $90,000 |
| 2019 | $3,064 | $106,800 | $16,800 | $90,000 |
| 2018 | $2,674 | $88,680 | $14,160 | $74,520 |
| 2016 | $2,458 | $77,560 | $12,400 | $65,160 |
| 2015 | $2,171 | $63,800 | $9,600 | $54,200 |
| 2014 | $2,179 | $63,800 | $9,600 | $54,200 |
Source: Public Records
Map
Nearby Homes
- 918 Hampton Trail NW
- 881 Huntington Way NW
- 4450 Bradstone Trace NW Unit 2
- 3951 Millwood Ln NW
- 3975 Bradstone Trace NW
- 3911 Millwood Ln NW
- 1146 Samuel Dr
- 4100 Bradstone Trace NW Unit 1
- 1118 Saybrook Cir NW
- 642 Huntington Way NW
- 1151 Overland Hill Trace
- 4059 Heritage Valley Ct
- 4017 Heritage Valley Ct
- 805 Pleasant Hill Rd NW Unit 212
- 805 Pleasant Hill Rd NW Unit 703
- 805 Pleasant Hill Rd NW Unit 53
- 805 Pleasant Hill Rd NW Unit 503
- 3826 Green Bay Dr Unit 2
- 566 Jody Place
- 4452 Burns Rd NW
- 4095 Shady Cir NW
- 4086 Shady Cir NW
- 911 Beaver Ln NW
- 4085 Shady Cir NW
- 921 Beaver Ln NW Unit I
- 882 Beaver Ln NW
- 901 Beaver Ln NW
- 931 Beaver Ln NW
- 931 Beaver Ln NW
- 931 Beaver Ln NW
- 4075 Shady Cir NW
- 941 Beaver Ln NW
- 946 Beaver Ln NW Unit 1
- 891 Beaver Ln NW Unit 1
- 4066 Shady Cir NW
- 947 Beaver Ln NW
- 4089 Pecan Ct NW Unit 1
- 4089 Pecan Ct NW
- 881 Beaver Ln NW
- 952 Beaver Ln NW