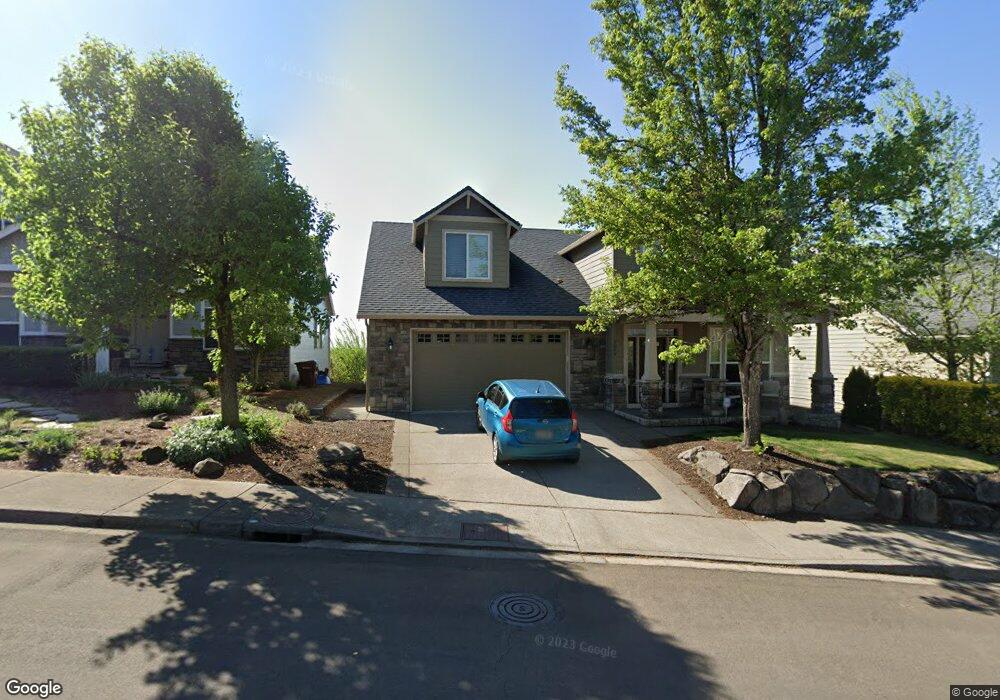
4099 Forest View Dr Washougal, WA 98671
Estimated Value: $649,813 - $686,000
3
Beds
3
Baths
2,351
Sq Ft
$285/Sq Ft
Est. Value
About This Home
This home is located at 4099 Forest View Dr, Washougal, WA 98671 and is currently estimated at $670,703, approximately $285 per square foot. 4099 Forest View Dr is a home located in Clark County with nearby schools including Gause Elementary School, Jemtegaard Middle School, and Washougal High School.
Ownership History
Date
Name
Owned For
Owner Type
Purchase Details
Closed on
Aug 26, 2020
Sold by
Rota John V and Rota Doris J
Bought by
Rota Mark A and Rota Kathleen L
Current Estimated Value
Purchase Details
Closed on
Aug 9, 2011
Sold by
Walsh Melinda Carol and Jennings Melinda W
Bought by
Rota Mark A and Rota Kathleen L
Home Financials for this Owner
Home Financials are based on the most recent Mortgage that was taken out on this home.
Original Mortgage
$176,000
Outstanding Balance
$121,633
Interest Rate
4.53%
Mortgage Type
New Conventional
Estimated Equity
$549,070
Purchase Details
Closed on
Jul 6, 2005
Sold by
Mckie Charles A and Mckie Carol J
Bought by
Jennings Melinda W
Home Financials for this Owner
Home Financials are based on the most recent Mortgage that was taken out on this home.
Original Mortgage
$288,000
Interest Rate
5.75%
Mortgage Type
Fannie Mae Freddie Mac
Purchase Details
Closed on
Jul 26, 2004
Sold by
Benefit Development Llc
Bought by
Mckie Charles A and Mckie Carol J
Create a Home Valuation Report for This Property
The Home Valuation Report is an in-depth analysis detailing your home's value as well as a comparison with similar homes in the area
Home Values in the Area
Average Home Value in this Area
Purchase History
| Date | Buyer | Sale Price | Title Company |
|---|---|---|---|
| Rota Mark A | -- | Clark County Title Company | |
| Rota Mark A | $220,000 | Fidelity National Title | |
| Jennings Melinda W | $360,000 | Cascade Title | |
| Mckie Charles A | $69,900 | Stewart Title |
Source: Public Records
Mortgage History
| Date | Status | Borrower | Loan Amount |
|---|---|---|---|
| Open | Rota Mark A | $176,000 | |
| Previous Owner | Jennings Melinda W | $288,000 |
Source: Public Records
Tax History Compared to Growth
Tax History
| Year | Tax Paid | Tax Assessment Tax Assessment Total Assessment is a certain percentage of the fair market value that is determined by local assessors to be the total taxable value of land and additions on the property. | Land | Improvement |
|---|---|---|---|---|
| 2025 | $592 | $606,090 | $150,000 | $456,090 |
| 2024 | $573 | $577,234 | $149,000 | $428,234 |
| 2023 | $575 | $604,011 | $159,800 | $444,211 |
| 2022 | $664 | $582,978 | $159,800 | $423,178 |
| 2021 | $721 | $495,927 | $137,000 | $358,927 |
| 2020 | $726 | $449,274 | $125,000 | $324,274 |
| 2019 | $1,858 | $443,972 | $125,000 | $318,972 |
| 2018 | $792 | $300,698 | $0 | $0 |
| 2017 | $3,950 | $120,279 | $0 | $0 |
| 2016 | $3,839 | $338,352 | $0 | $0 |
| 2015 | $3,729 | $300,698 | $0 | $0 |
| 2014 | -- | $290,626 | $0 | $0 |
| 2013 | -- | $259,248 | $0 | $0 |
Source: Public Records
Map
Nearby Homes
- 4069 Forest View Dr
- 4109 Forest View Dr
- 4049 Forest View Dr
- 3256 39th Ct
- 4054 Forest View Dr
- 4039 Forest View Dr
- 4114 Forest View Dr
- 3266 39th Ct
- 0 39th Lot 13 Ct Unit 8002435
- 0 39th Lot 13 Ct Unit 8002454
- 4044 Forest View Dr
- 4029 Forest View Dr
- 3236 39th Ct
- 3276 39th Ct
- 4034 Forest View Dr
- 3167 41st Ct
- 4124 Forest View Dr
- 4189 Forest View Dr
- 3168 41st Ct
- 3194 40th St