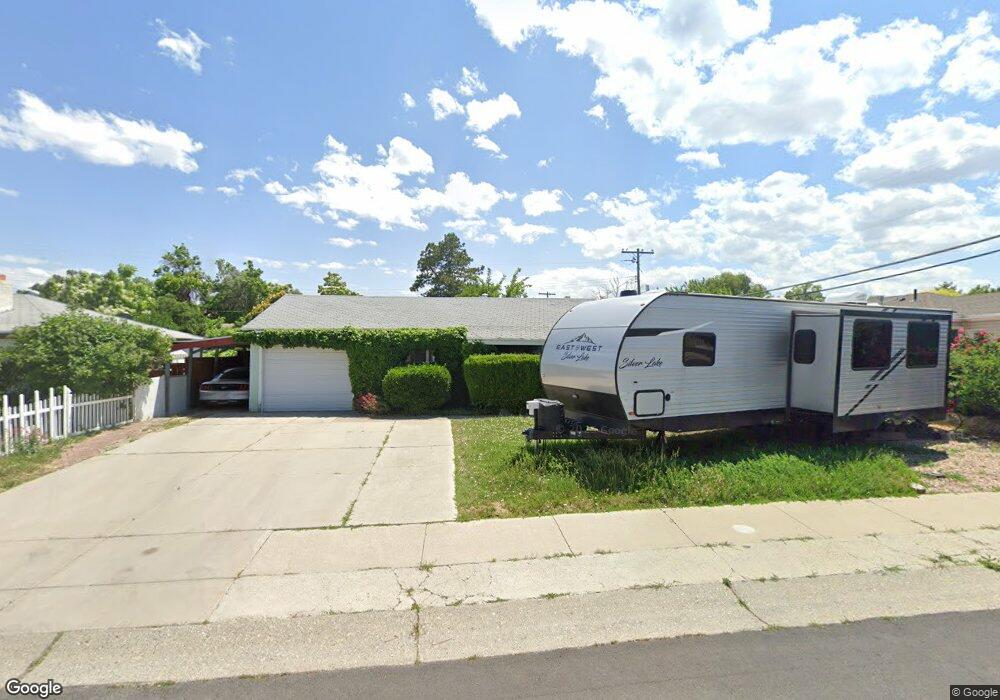
4099 W 5540 S Salt Lake City, UT 84118
Estimated Value: $396,000 - $403,000
3
Beds
2
Baths
1,440
Sq Ft
$277/Sq Ft
Est. Value
About This Home
This home is located at 4099 W 5540 S, Salt Lake City, UT 84118 and is currently estimated at $399,098, approximately $277 per square foot. 4099 W 5540 S is a home located in Salt Lake County with nearby schools including South Kearns Elementary School, Kearns Jr High School, and Kearns High School.
Ownership History
Date
Name
Owned For
Owner Type
Purchase Details
Closed on
May 8, 2012
Sold by
Keener Ronald E
Bought by
Howard Kam
Current Estimated Value
Home Financials for this Owner
Home Financials are based on the most recent Mortgage that was taken out on this home.
Original Mortgage
$96,900
Outstanding Balance
$67,263
Interest Rate
3.94%
Mortgage Type
New Conventional
Estimated Equity
$331,835
Purchase Details
Closed on
Mar 12, 2012
Sold by
Cox Timothy Ronald
Bought by
Keener Ronald E
Home Financials for this Owner
Home Financials are based on the most recent Mortgage that was taken out on this home.
Original Mortgage
$96,900
Outstanding Balance
$67,263
Interest Rate
3.94%
Mortgage Type
New Conventional
Estimated Equity
$331,835
Purchase Details
Closed on
Aug 1, 2001
Sold by
Keener Mary Alice
Bought by
The Mary Alice Keener Living Trust and Keener Mary Alice
Create a Home Valuation Report for This Property
The Home Valuation Report is an in-depth analysis detailing your home's value as well as a comparison with similar homes in the area
Home Values in the Area
Average Home Value in this Area
Purchase History
| Date | Buyer | Sale Price | Title Company |
|---|---|---|---|
| Howard Kam | -- | None Available | |
| Keener Ronald E | -- | Integrated Title Ins Svcs | |
| The Mary Alice Keener Living Trust | -- | -- |
Source: Public Records
Mortgage History
| Date | Status | Borrower | Loan Amount |
|---|---|---|---|
| Open | Howard Kam | $96,900 |
Source: Public Records
Tax History Compared to Growth
Tax History
| Year | Tax Paid | Tax Assessment Tax Assessment Total Assessment is a certain percentage of the fair market value that is determined by local assessors to be the total taxable value of land and additions on the property. | Land | Improvement |
|---|---|---|---|---|
| 2025 | $2,552 | $355,500 | $88,200 | $267,300 |
| 2024 | $2,552 | $335,000 | $82,800 | $252,200 |
| 2023 | $2,309 | $298,600 | $79,600 | $219,000 |
| 2022 | $2,430 | $315,400 | $78,100 | $237,300 |
| 2021 | $2,215 | $259,700 | $60,100 | $199,600 |
| 2020 | $1,889 | $212,200 | $54,700 | $157,500 |
| 2019 | $1,940 | $209,500 | $51,600 | $157,900 |
| 2018 | $1,811 | $194,300 | $51,600 | $142,700 |
| 2017 | $1,494 | $167,800 | $51,600 | $116,200 |
| 2016 | $1,317 | $142,600 | $47,600 | $95,000 |
| 2015 | $1,202 | $119,000 | $58,000 | $61,000 |
| 2014 | $1,058 | $108,400 | $53,900 | $54,500 |
Source: Public Records
Map
Nearby Homes