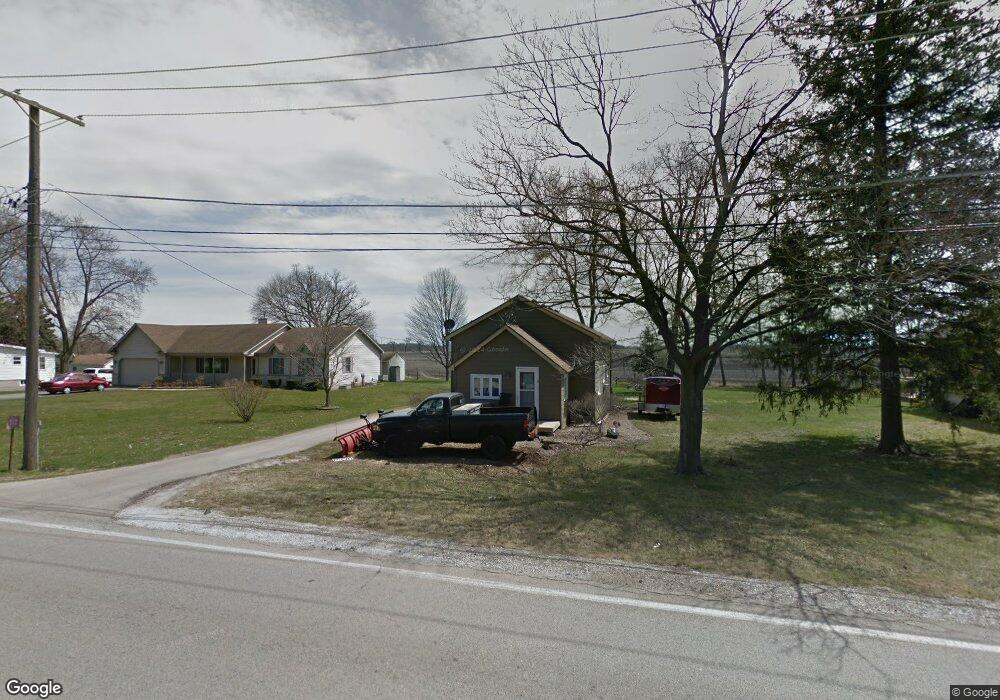
40W919 Oak St Pingree Grove, IL 60140
Estimated Value: $230,996 - $299,000
2
Beds
2
Baths
720
Sq Ft
$359/Sq Ft
Est. Value
About This Home
This home is located at 40W919 Oak St, Pingree Grove, IL 60140 and is currently estimated at $258,749, approximately $359 per square foot. 40W919 Oak St is a home with nearby schools including Howard B. Thomas Grade School, Prairie Knolls Middle School, and Central Middle School.
Ownership History
Date
Name
Owned For
Owner Type
Purchase Details
Closed on
Aug 30, 2021
Sold by
Drews Brian and Doran Maureen
Bought by
Keyes Jackson
Current Estimated Value
Home Financials for this Owner
Home Financials are based on the most recent Mortgage that was taken out on this home.
Original Mortgage
$168,875
Outstanding Balance
$153,434
Interest Rate
2.7%
Mortgage Type
New Conventional
Estimated Equity
$105,315
Purchase Details
Closed on
Dec 13, 2018
Sold by
Bendinelli Rikki and Dexter Chad
Bought by
Drews Brian and Doran Maureen
Home Financials for this Owner
Home Financials are based on the most recent Mortgage that was taken out on this home.
Original Mortgage
$132,456
Interest Rate
5.5%
Mortgage Type
FHA
Purchase Details
Closed on
Oct 2, 2015
Sold by
Sliwinski Lynn
Bought by
Bendinelli Rikki
Home Financials for this Owner
Home Financials are based on the most recent Mortgage that was taken out on this home.
Original Mortgage
$100,642
Interest Rate
4.4%
Mortgage Type
FHA
Create a Home Valuation Report for This Property
The Home Valuation Report is an in-depth analysis detailing your home's value as well as a comparison with similar homes in the area
Home Values in the Area
Average Home Value in this Area
Purchase History
| Date | Buyer | Sale Price | Title Company |
|---|---|---|---|
| Keyes Jackson | $175,000 | Old Republic Title | |
| Drews Brian | $135,000 | First American Title | |
| Bendinelli Rikki | $102,500 | Fatic |
Source: Public Records
Mortgage History
| Date | Status | Borrower | Loan Amount |
|---|---|---|---|
| Open | Keyes Jackson | $168,875 | |
| Previous Owner | Drews Brian | $132,456 | |
| Previous Owner | Bendinelli Rikki | $100,642 |
Source: Public Records
Tax History Compared to Growth
Tax History
| Year | Tax Paid | Tax Assessment Tax Assessment Total Assessment is a certain percentage of the fair market value that is determined by local assessors to be the total taxable value of land and additions on the property. | Land | Improvement |
|---|---|---|---|---|
| 2024 | $4,383 | $62,935 | $18,425 | $44,510 |
| 2023 | $4,174 | $56,929 | $16,667 | $40,262 |
| 2022 | $3,541 | $46,207 | $14,238 | $31,969 |
| 2021 | $2,928 | $38,318 | $13,755 | $24,563 |
| 2020 | $2,911 | $37,630 | $13,508 | $24,122 |
| 2019 | $2,904 | $37,143 | $13,333 | $23,810 |
| 2018 | $2,522 | $33,148 | $14,012 | $19,136 |
| 2017 | $2,408 | $31,608 | $13,657 | $17,951 |
| 2016 | $2,537 | $30,858 | $13,333 | $17,525 |
| 2015 | -- | $23,437 | $13,111 | $10,326 |
| 2014 | -- | $23,437 | $13,111 | $10,326 |
| 2013 | -- | $22,579 | $13,335 | $9,244 |
Source: Public Records
Map
Nearby Homes
- 3301 U S 20
- 41W625 U S 20
- 14N515 Highland Ave
- 703 Anchorage Ct
- 695 Anchorage Ct
- 3704 Heathmoor Dr
- 801 Marlisle Ln
- Lot 88 Broadleaf Ave
- 638 Dover St
- 777 Lansmere Ave
- 700 Brighton Dr
- 905 Shelter Island Ln
- 395 Brookhaven Trail
- 3658 Broadleaf Ave
- 410 Brookhaven Trail
- 760 Canterbury Ln
- 975 Valley Stream Dr
- The Ontario Plan at Highland Woods
- The Ashbury - Sideload Plan at Highland Woods
- The Craftsman - Sideload Plan at Highland Woods
- 40W939 Oak St
- 40W899 Oak St
- 40W885 Oak St
- 40W890 Oak St
- 40W968 Oak St
- 40W912 Oak St
- 40W866 Oak St Unit 20
- 40W990 Oak St
- 13N680 Grove St
- LOT 1 U S 20
- 40W850 Oak St
- 41W006 Oak St
- 41W003 Jackson St
- 1363 Jackson St
- 1383 Jackson St
- 1373 Jackson St
- 1353 Jackson St
- 1414 Jackson St
- 1404 Jackson St
- 1364 Jackson St