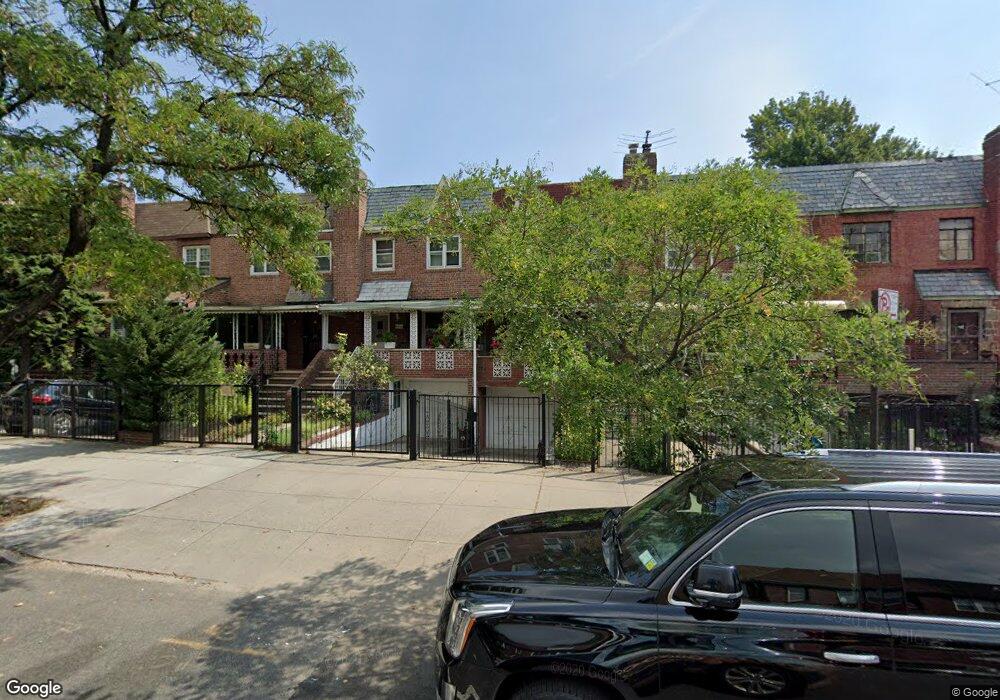
41-20 39th St Sunnyside, NY 11104
Sunnyside NeighborhoodEstimated Value: $11,759,690
--
Bed
--
Bath
39,000
Sq Ft
$302/Sq Ft
Est. Value
About This Home
This home is located at 41-20 39th St, Sunnyside, NY 11104 and is currently estimated at $11,759,690, approximately $301 per square foot. 41-20 39th St is a home located in Queens County with nearby schools including P.S. 150Q Sunnyside, Long Island City High School, and Most Precious Blood Roman Catholic Church.
Ownership History
Date
Name
Owned For
Owner Type
Purchase Details
Closed on
Dec 30, 2020
Sold by
Boerum Development Llc
Bought by
Jx Holdings Llc
Current Estimated Value
Purchase Details
Closed on
Feb 11, 2015
Sold by
Anna Louise Realty Llc
Bought by
Boerum Development Llc
Purchase Details
Closed on
Jan 9, 2014
Sold by
Anna Louise Realty Corp
Bought by
Anna Louise Realty Llc
Home Financials for this Owner
Home Financials are based on the most recent Mortgage that was taken out on this home.
Original Mortgage
$1,000,000
Interest Rate
4.45%
Mortgage Type
Commercial
Purchase Details
Closed on
Jul 27, 2001
Sold by
41-20 Assoc Llc
Bought by
Anna Louise Realty Corp
Purchase Details
Closed on
Jul 25, 2000
Sold by
C & C Brothers Holding Corp
Bought by
41-20 Associates Llc
Home Financials for this Owner
Home Financials are based on the most recent Mortgage that was taken out on this home.
Original Mortgage
$390,000
Interest Rate
10.5%
Mortgage Type
Commercial
Create a Home Valuation Report for This Property
The Home Valuation Report is an in-depth analysis detailing your home's value as well as a comparison with similar homes in the area
Home Values in the Area
Average Home Value in this Area
Purchase History
| Date | Buyer | Sale Price | Title Company |
|---|---|---|---|
| Jx Holdings Llc | $10,250,000 | -- | |
| Jx Holdings Llc | $10,250,000 | -- | |
| Boerum Development Llc | $13,000,000 | -- | |
| Boerum Development Llc | $13,000,000 | -- | |
| Anna Louise Realty Llc | -- | -- | |
| Anna Louise Realty Llc | -- | -- | |
| Anna Louise Realty Corp | -- | -- | |
| Anna Louise Realty Corp | -- | -- | |
| 41-20 Associates Llc | $600,000 | Fidelity National Title Ins | |
| 41-20 Associates Llc | $600,000 | Fidelity National Title Ins |
Source: Public Records
Mortgage History
| Date | Status | Borrower | Loan Amount |
|---|---|---|---|
| Previous Owner | Anna Louise Realty Llc | $1,000,000 | |
| Previous Owner | 41-20 Associates Llc | $390,000 |
Source: Public Records
Tax History Compared to Growth
Tax History
| Year | Tax Paid | Tax Assessment Tax Assessment Total Assessment is a certain percentage of the fair market value that is determined by local assessors to be the total taxable value of land and additions on the property. | Land | Improvement |
|---|---|---|---|---|
| 2025 | $222,661 | $2,606,540 | $464,400 | $2,142,140 |
| 2024 | $222,661 | $2,757,000 | $464,400 | $2,292,600 |
| 2023 | $234,936 | $3,036,600 | $464,400 | $2,572,200 |
| 2022 | $220,315 | $3,122,550 | $464,400 | $2,658,150 |
| 2021 | $144,581 | $2,497,950 | $464,400 | $2,033,550 |
| 2020 | $155,373 | $3,118,950 | $464,400 | $2,654,550 |
| 2019 | $115,860 | $3,105,900 | $464,400 | $2,641,500 |
| 2018 | $75,751 | $2,357,580 | $339,660 | $2,017,920 |
| 2017 | $56,908 | $2,221,560 | $298,080 | $1,923,480 |
| 2016 | $39,009 | $2,221,560 | $298,080 | $1,923,480 |
| 2015 | $12,326 | $2,044,170 | $256,500 | $1,787,670 |
| 2014 | $12,326 | $1,951,470 | $256,500 | $1,694,970 |
Source: Public Records
Map
Nearby Homes
- 41-13 39th Place Unit 3
- 41-15 39th Place Unit 3
- 41-15 39th Place Unit 1
- 41-21 39th Place
- 41-12 41st St Unit 3 H
- 41-12 41st St Unit 2J
- 41-09 41st St Unit 1-D
- 41-41 41st St Unit 1G
- 43-32 40th St
- 41-42 42nd St Unit E4
- 4107 42nd St Unit 2J
- 41-08 43rd St Unit 5J
- 2594 40th St
- 45-08 40th St Unit F44
- 45-08 40th St Unit F32
- 4333 42nd St Unit 6A
- 43-33 42nd St Unit 6B
- 39-47 43rd St
- 41-02 Queens Blvd Unit 4H
- 41-02 Queens Blvd Unit 5-E
- 41-19 39th St Unit Fl-1
- 41-19 39th St Unit Fl 2F
- 41-19 39th St Unit Fl 2R
- 41-19 39th St Unit 2
- 3902 Skillman Ave
- 4119 39th St
- 4119 39th St Unit Fl-1
- 4119 39th St Unit 2
- 3914 Skillman Ave
- 4110 39th Place
- 4108 39th Place
- 4112 39th Place
- 4106 39th Place
- 4104 39th Place
- 4102 39th Place
- 4118 39th Place
- 4120 39th St
- 4120 39th St
- 4120 39th Place
- 3802 Skillman Ave