Estimated Value: $464,000 - $606,365
--
Bed
1
Bath
827
Sq Ft
$647/Sq Ft
Est. Value
About This Home
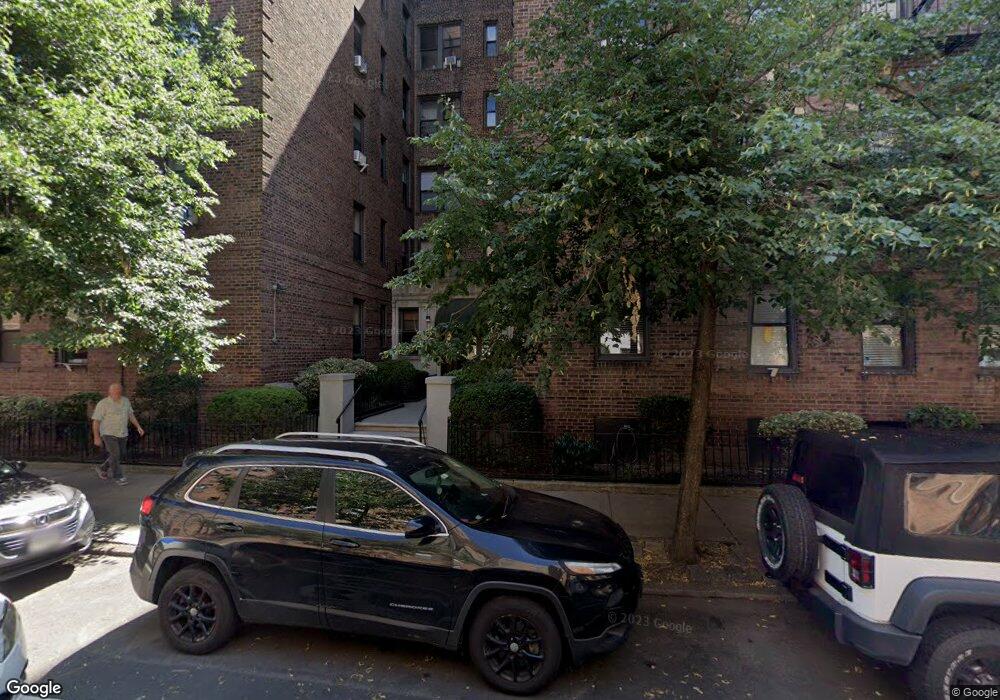
This home is located at 41-21 42nd St Unit 1A, Sunnyside, NY 11104 and is currently estimated at $535,091, approximately $647 per square foot. 41-21 42nd St Unit 1A is a home located in Queens County with nearby schools including P.S. 150Q Sunnyside, Long Island City High School, and Our World Neighborhood Charter School.
Ownership History
Date
Name
Owned For
Owner Type
Purchase Details
Closed on
May 23, 2024
Sold by
Lam Duc
Bought by
Gurer Pelin and Gurer Ugur
Current Estimated Value
Home Financials for this Owner
Home Financials are based on the most recent Mortgage that was taken out on this home.
Original Mortgage
$437,250
Outstanding Balance
$432,580
Interest Rate
7.17%
Mortgage Type
Purchase Money Mortgage
Estimated Equity
$117,914
Purchase Details
Closed on
Jun 27, 2008
Sold by
Welsh Kathleen
Bought by
Lam Duc
Purchase Details
Closed on
May 10, 2001
Sold by
Geleski Edward M and Welsh Kathleen
Bought by
Welsh Kathleen
Purchase Details
Closed on
Feb 10, 2000
Sold by
Matteson Robert S and Matteson Isabelle
Bought by
Matteson Robert S
Create a Home Valuation Report for This Property
The Home Valuation Report is an in-depth analysis detailing your home's value as well as a comparison with similar homes in the area
Home Values in the Area
Average Home Value in this Area
Purchase History
| Date | Buyer | Sale Price | Title Company |
|---|---|---|---|
| Gurer Pelin | $583,000 | -- | |
| Gurer Pelin | $583,000 | -- | |
| Lam Duc | $345,000 | -- | |
| Lam Duc | $345,000 | -- | |
| Welsh Kathleen | -- | -- | |
| Welsh Kathleen | -- | -- | |
| Matteson Robert S | -- | Long Island Title Agency | |
| Geleski Edward M | $115,000 | Long Island Title Agency | |
| Geleski Edward M | $115,000 | Long Island Title Agency |
Source: Public Records
Mortgage History
| Date | Status | Borrower | Loan Amount |
|---|---|---|---|
| Open | Gurer Pelin | $437,250 | |
| Closed | Gurer Pelin | $437,250 | |
| Previous Owner | Lam Duc | $80,000 | |
| Previous Owner | Lam Duc | $310,500 | |
| Previous Owner | Welsh Kathleen | $71,000 | |
| Previous Owner | Welsch Kathleen | $184,000 | |
| Previous Owner | Welsh Kathleen | $50,000 | |
| Previous Owner | Geleski Edward M | $84,000 |
Source: Public Records
Tax History Compared to Growth
Tax History
| Year | Tax Paid | Tax Assessment Tax Assessment Total Assessment is a certain percentage of the fair market value that is determined by local assessors to be the total taxable value of land and additions on the property. | Land | Improvement |
|---|---|---|---|---|
| 2025 | $4,056 | $33,279 | $5,163 | $28,116 |
| 2024 | $2,916 | $32,441 | $5,163 | $27,278 |
| 2023 | $3,951 | $31,601 | $5,163 | $26,438 |
| 2022 | $2,680 | $32,546 | $5,163 | $27,383 |
| 2021 | $2,390 | $27,092 | $5,163 | $21,929 |
| 2020 | $2,646 | $32,529 | $5,163 | $27,366 |
| 2019 | $2,558 | $31,595 | $5,163 | $26,432 |
| 2018 | $3,420 | $26,887 | $5,163 | $21,724 |
| 2017 | $3,305 | $25,983 | $5,162 | $20,821 |
| 2016 | $3,218 | $25,983 | $5,162 | $20,821 |
| 2015 | $1,685 | $24,008 | $5,163 | $18,845 |
| 2014 | $1,685 | $22,760 | $5,163 | $17,597 |
Source: Public Records
About This Building
Map
Nearby Homes
- 4107 42nd St Unit 2J
- 41-08 43rd St Unit 5J
- 41-08 43rd St Unit 3F
- 41-42 42nd St Unit 4L
- 41-12 41st St Unit 2N
- 41-12 41st St Unit 3 H
- 41-12 41st St Unit 2J
- 43-08 41st St Unit 5D
- 39-61 44th St
- 41-15 39th Place Unit 3
- 41-15 39th Place Unit 1
- 44-15 43rd Ave Unit 5N
- 41-13 39th Place Unit 3
- 41-35 45th St Unit 2B
- 4333 42nd St Unit 6A
- 43-33 42nd St Unit 6B
- 3951 45th St Unit 1
- 43-32 40th St
- 43-13 Queens Blvd
- 43-42 45th St Unit 4O
- 41-21 42nd St Unit 2D
- 41-21 42nd St Unit 3A
- 41-21 42nd St Unit 4A
- 41-21 42nd St Unit 4D
- 41-21 42nd St Unit AAA
- 41-21 42nd St Unit 1Aa
- 41-21 42nd St Unit 2F
- 41-21 42nd St Unit 4-J
- 41-21 42nd St Unit 6H
- 41-21 42nd St
- 41-21 42nd St Unit 1C
- 41-21 42nd St Unit 4C
- 4107 42nd St
- 4107 42nd St
- 4107 42nd St Unit 3A
- 4107 42nd St Unit 5E
- 4107 42nd St Unit 4F
- 4107 42nd St Unit 4G
- 4107 42nd St Unit 5K
- 4107 42nd St Unit 2K