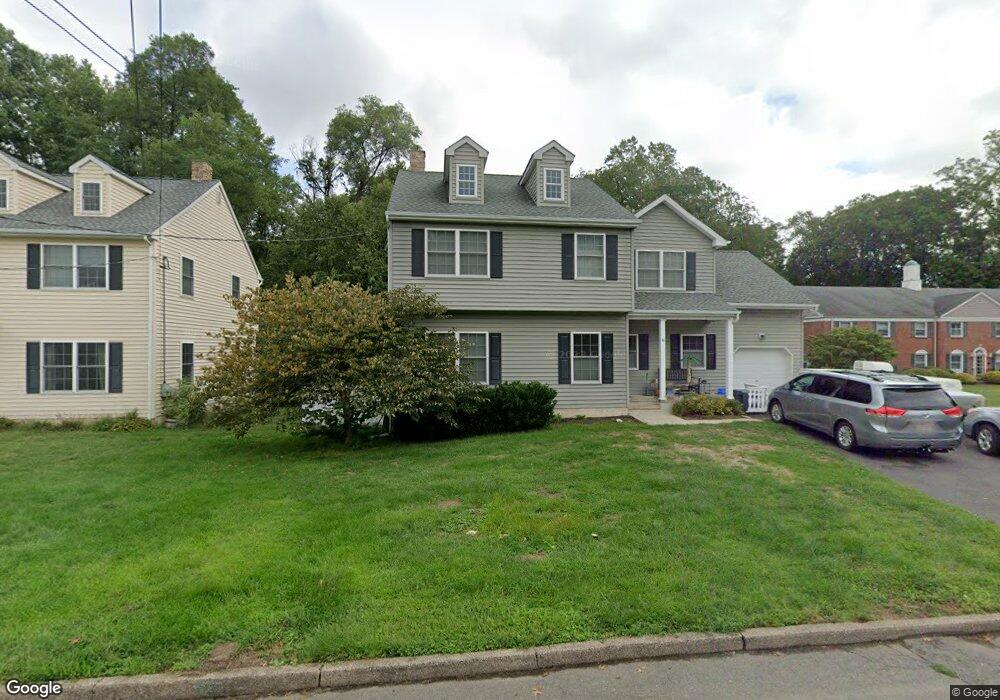
41 3rd St Bordentown, NJ 08505
Estimated Value: $477,000 - $613,103
4
Beds
3
Baths
1,915
Sq Ft
$287/Sq Ft
Est. Value
About This Home
This home is located at 41 3rd St, Bordentown, NJ 08505 and is currently estimated at $548,776, approximately $286 per square foot. 41 3rd St is a home located in Burlington County with nearby schools including Bordentown Reg High School and St Raphael School.
Ownership History
Date
Name
Owned For
Owner Type
Purchase Details
Closed on
Oct 31, 2011
Sold by
M T T Corp
Bought by
Macewan Michael J and Macewan Stacey H
Current Estimated Value
Purchase Details
Closed on
May 15, 2008
Sold by
Majer Improvements Llc and Carty Robert W
Bought by
Capital Health Systems Inc
Purchase Details
Closed on
Mar 31, 2005
Sold by
5 Third Street Associates Llc
Bought by
5 Third Street Associates Llc
Create a Home Valuation Report for This Property
The Home Valuation Report is an in-depth analysis detailing your home's value as well as a comparison with similar homes in the area
Home Values in the Area
Average Home Value in this Area
Purchase History
| Date | Buyer | Sale Price | Title Company |
|---|---|---|---|
| Macewan Michael J | $345,500 | General Abstract & Title Age | |
| M T T Corp | -- | General Abstract & Title Age | |
| Capital Health Systems Inc | $550,000 | Multiple | |
| 5 Third Street Associates Llc | -- | -- |
Source: Public Records
Tax History Compared to Growth
Tax History
| Year | Tax Paid | Tax Assessment Tax Assessment Total Assessment is a certain percentage of the fair market value that is determined by local assessors to be the total taxable value of land and additions on the property. | Land | Improvement |
|---|---|---|---|---|
| 2025 | $11,863 | $322,200 | $61,400 | $260,800 |
| 2024 | $11,377 | $322,200 | $61,400 | $260,800 |
| 2023 | $11,377 | $322,200 | $61,400 | $260,800 |
| 2022 | $10,984 | $322,200 | $61,400 | $260,800 |
| 2021 | $11,116 | $322,200 | $61,400 | $260,800 |
| 2020 | $11,200 | $322,200 | $61,400 | $260,800 |
| 2019 | $11,329 | $322,200 | $61,400 | $260,800 |
| 2018 | $11,161 | $322,200 | $61,400 | $260,800 |
| 2017 | $10,836 | $322,200 | $61,400 | $260,800 |
| 2016 | $10,732 | $322,200 | $61,400 | $260,800 |
| 2015 | $10,655 | $322,200 | $61,400 | $260,800 |
| 2014 | $10,146 | $322,200 | $61,400 | $260,800 |
Source: Public Records
Map
Nearby Homes