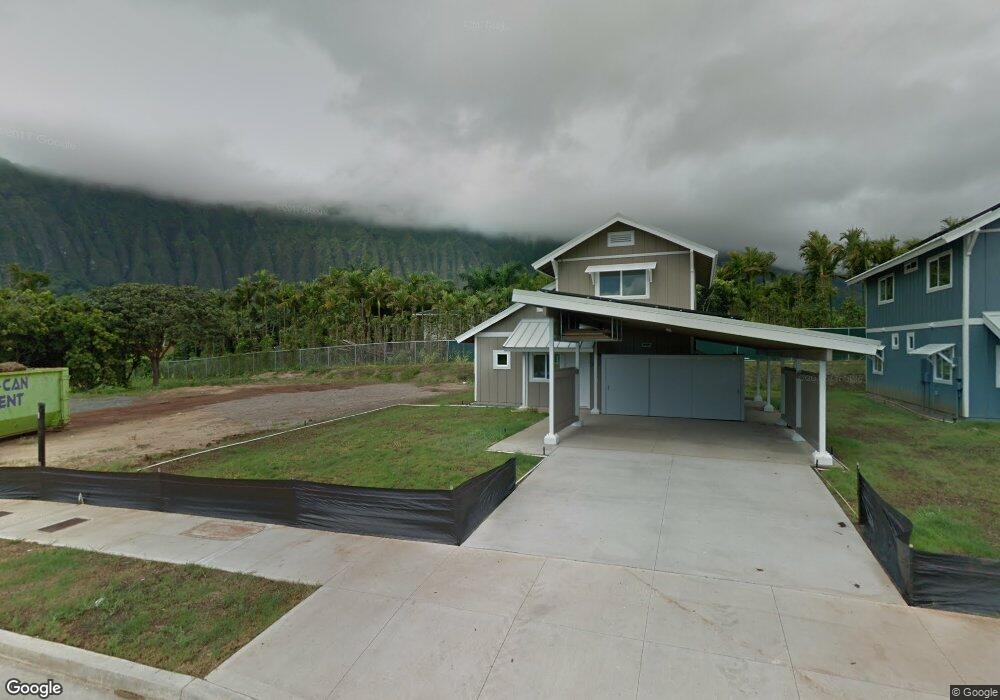
41-711 Kakaina St Waimanalo, HI 96795
Estimated Value: $1,345,000 - $1,856,000
6
Beds
4
Baths
3,012
Sq Ft
$541/Sq Ft
Est. Value
About This Home
This home is located at 41-711 Kakaina St, Waimanalo, HI 96795 and is currently estimated at $1,629,746, approximately $541 per square foot. 41-711 Kakaina St is a home located in Honolulu County with nearby schools including Waimanalo Elementary/Intermediate School, Kailua High School, and St John Vianney Parish School.
Ownership History
Date
Name
Owned For
Owner Type
Purchase Details
Closed on
Dec 30, 2011
Sold by
Iwaniec John Edward and Iwaniec Elizabeth
Bought by
Vidinhar Bruce Edward and Vidinhar Joann Anela
Current Estimated Value
Home Financials for this Owner
Home Financials are based on the most recent Mortgage that was taken out on this home.
Original Mortgage
$625,500
Outstanding Balance
$428,003
Interest Rate
3.94%
Mortgage Type
New Conventional
Estimated Equity
$1,201,743
Purchase Details
Closed on
May 28, 2002
Sold by
Nam Margaret O K
Bought by
Iwaniec John Edward and Iwaniec Elizabeth
Home Financials for this Owner
Home Financials are based on the most recent Mortgage that was taken out on this home.
Original Mortgage
$450,300
Interest Rate
6.75%
Mortgage Type
Construction
Create a Home Valuation Report for This Property
The Home Valuation Report is an in-depth analysis detailing your home's value as well as a comparison with similar homes in the area
Home Values in the Area
Average Home Value in this Area
Purchase History
| Date | Buyer | Sale Price | Title Company |
|---|---|---|---|
| Vidinhar Bruce Edward | $900,000 | Tg | |
| Vidinhar Bruce Edward | $900,000 | Tg | |
| Iwaniec John Edward | $320,000 | -- |
Source: Public Records
Mortgage History
| Date | Status | Borrower | Loan Amount |
|---|---|---|---|
| Open | Vidinhar Bruce Edward | $625,500 | |
| Closed | Vidinhar Bruce Edward | $625,500 | |
| Previous Owner | Iwaniec John Edward | $450,300 |
Source: Public Records
Tax History Compared to Growth
Tax History
| Year | Tax Paid | Tax Assessment Tax Assessment Total Assessment is a certain percentage of the fair market value that is determined by local assessors to be the total taxable value of land and additions on the property. | Land | Improvement |
|---|---|---|---|---|
| 2025 | $2,832 | $844,000 | $390,500 | $453,500 |
| 2024 | $2,832 | $802,300 | $342,900 | $459,400 |
| 2023 | $2,493 | $788,800 | $342,800 | $446,000 |
| 2022 | $2,774 | $773,200 | $1,141,300 | $430,600 |
| 2021 | $2,856 | $791,300 | $1,141,300 | $448,500 |
| 2020 | $2,931 | $808,300 | $1,141,300 | $465,600 |
| 2019 | $1,684 | $559,500 | $342,800 | $216,700 |
| 2018 | $1,486 | $503,100 | $287,500 | $215,600 |
| 2017 | $1,596 | $534,200 | $287,800 | $246,400 |
| 2016 | $1,601 | $535,900 | $287,600 | $248,300 |
| 2015 | $17 | $530,700 | $287,900 | $242,800 |
| 2014 | -- | $529,400 | $287,500 | $241,900 |
Source: Public Records
Map
Nearby Homes
- 41-1702 Kalanianaole Hwy
- 41-1441 Kuhimana St
- 41-569 Makakalo St
- 41-755 Kumuhau St
- 42-100 Old Kalanianaole Rd Unit 8
- 133 Kahako St Unit A
- 41-1025 Nenue St
- 42-311 Old Kalanianaole Rd
- 42-103 Old Kalanianaole Rd
- 41-51 Hinalea St
- 1450 Onioni St
- 1335 Onioni St
- 322 Keolu Dr
- 1433 Akanahe Place
- 1214 Kina St
- 1233 Keolu Dr
- 1227 Mowai St
- 1310 Hele St
- 1164 Manulani St
- 41-35 Wailea St
- 41-717 Kakaina St
- 41-709 Kakaina St
- 41-525 Kumuniu Place
- 41-1612 Koa Moali Place
- 41-1609 Koa Moali Place
- 41-1606 Koa Moali Place
- 41-1606 Koa Moali Place Unit B
- 41-809 Mekia St
- 41-809 Mekia St Unit A
- 41 Kakaina St
- 41-719 Kakaina St
- 41-749 Mekia St
- 41-753 Mekia St
- 41-743 Mekia St
- 41-739 Mekia St
- 41-733 Mekia St
- 41-727 Mekia St
- 41-750 Mekia St
- 41-1661 Kumuniu St
- 41-723 Mekia St