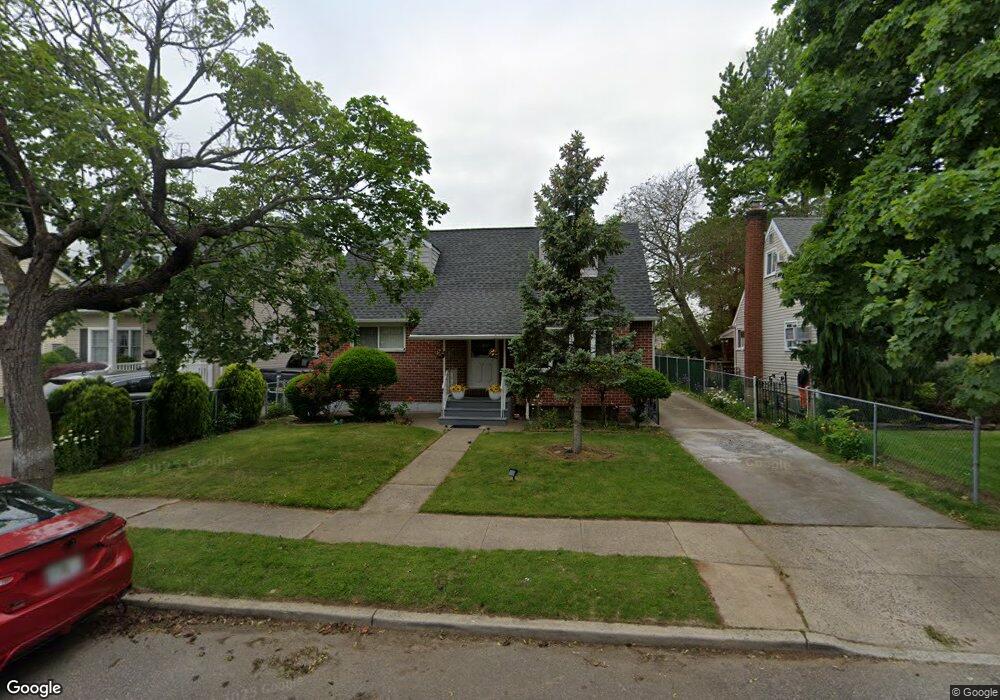
41 7th St New Hyde Park, NY 11040
Estimated Value: $915,000 - $924,362
4
Beds
3
Baths
1,234
Sq Ft
$745/Sq Ft
Est. Value
About This Home
This home is located at 41 7th St, New Hyde Park, NY 11040 and is currently estimated at $919,681, approximately $745 per square foot. 41 7th St is a home located in Nassau County with nearby schools including Chaminade High School.
Ownership History
Date
Name
Owned For
Owner Type
Purchase Details
Closed on
Aug 24, 2021
Sold by
Thomas Saji and Thomas Paul Valsa
Bought by
Philip Aleyamma and Philip Lizy
Current Estimated Value
Home Financials for this Owner
Home Financials are based on the most recent Mortgage that was taken out on this home.
Original Mortgage
$548,000
Interest Rate
2.8%
Mortgage Type
New Conventional
Purchase Details
Closed on
Apr 23, 2008
Sold by
Scatigno Teresa
Bought by
Paul Valsa
Purchase Details
Closed on
Mar 17, 2005
Sold by
Scatigno Pietro
Create a Home Valuation Report for This Property
The Home Valuation Report is an in-depth analysis detailing your home's value as well as a comparison with similar homes in the area
Home Values in the Area
Average Home Value in this Area
Purchase History
| Date | Buyer | Sale Price | Title Company |
|---|---|---|---|
| Philip Aleyamma | $755,000 | Judicial Title | |
| Paul Valsa | $490,000 | -- | |
| -- | -- | -- |
Source: Public Records
Mortgage History
| Date | Status | Borrower | Loan Amount |
|---|---|---|---|
| Previous Owner | Philip Aleyamma | $548,000 |
Source: Public Records
Tax History Compared to Growth
Tax History
| Year | Tax Paid | Tax Assessment Tax Assessment Total Assessment is a certain percentage of the fair market value that is determined by local assessors to be the total taxable value of land and additions on the property. | Land | Improvement |
|---|---|---|---|---|
| 2025 | $13,055 | $586 | $410 | $176 |
| 2024 | $3,993 | $582 | $410 | $172 |
| 2023 | $12,398 | $616 | $459 | $157 |
| 2022 | $9,908 | $582 | $410 | $172 |
| 2021 | $9,858 | $619 | $436 | $183 |
| 2020 | $10,107 | $771 | $728 | $43 |
| 2019 | $11,029 | $826 | $686 | $140 |
| 2018 | $11,029 | $939 | $0 | $0 |
| 2017 | $6,737 | $939 | $780 | $159 |
| 2016 | $10,247 | $939 | $780 | $159 |
| 2015 | $3,345 | $939 | $780 | $159 |
| 2014 | $3,345 | $939 | $780 | $159 |
| 2013 | $3,174 | $939 | $780 | $159 |
Source: Public Records
Map
Nearby Homes