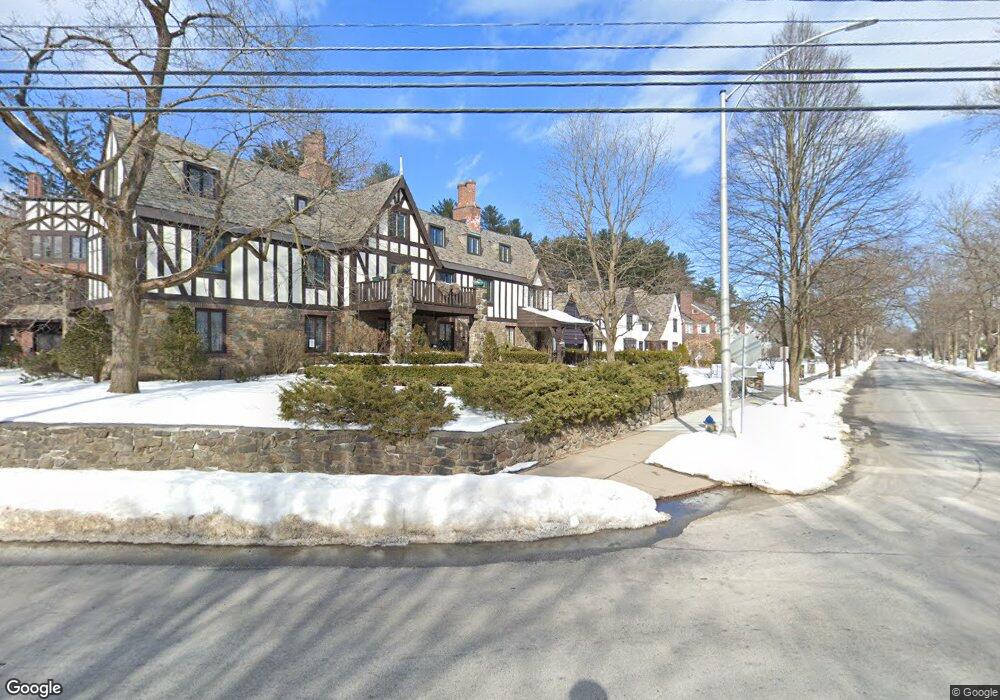
41 A Horicon Ave Glens Falls, NY 12801
Estimated Value: $260,901 - $360,000
2
Beds
3
Baths
1
Sq Ft
$295,225/Sq Ft
Est. Value
About This Home
This home is located at 41 A Horicon Ave, Glens Falls, NY 12801 and is currently estimated at $295,225, approximately $295,225 per square foot. 41 A Horicon Ave is a home located in Warren County with nearby schools including Glens Falls Senior High School and St. Mary-St. Alphonsus Catholic School.
Ownership History
Date
Name
Owned For
Owner Type
Purchase Details
Closed on
Feb 20, 2015
Sold by
Culligan Sean
Bought by
Balschunat Lisa
Current Estimated Value
Home Financials for this Owner
Home Financials are based on the most recent Mortgage that was taken out on this home.
Original Mortgage
$146,800
Outstanding Balance
$112,355
Interest Rate
3.74%
Mortgage Type
Unknown
Estimated Equity
$182,870
Purchase Details
Closed on
Feb 12, 2008
Sold by
Brooks Mary K
Bought by
Culligan Sean M
Purchase Details
Closed on
Jan 28, 2005
Sold by
Holcomb Lawrence
Bought by
Brooks Mary
Purchase Details
Closed on
Nov 26, 1997
Sold by
Tracey Cheryl L
Bought by
Leombruno Michael A and Leombruno Cheryl L
Purchase Details
Closed on
Oct 7, 1997
Purchase Details
Closed on
Apr 1, 1997
Sold by
Underwood Douglas G
Bought by
Williams Richard J and Ritchie Diana L
Purchase Details
Closed on
Mar 20, 1997
Sold by
Bishop Janice W
Bought by
Tracey Cheryl L
Create a Home Valuation Report for This Property
The Home Valuation Report is an in-depth analysis detailing your home's value as well as a comparison with similar homes in the area
Home Values in the Area
Average Home Value in this Area
Purchase History
| Date | Buyer | Sale Price | Title Company |
|---|---|---|---|
| Balschunat Lisa | $196,000 | Joanne Chwiecko | |
| Culligan Sean M | $150,000 | Scott Staples | |
| Brooks Mary | $128,000 | -- | |
| Leombruno Michael A | -- | -- | |
| -- | -- | -- | |
| Williams Richard J | $15,000 | -- | |
| Tracey Cheryl L | $62,000 | -- |
Source: Public Records
Mortgage History
| Date | Status | Borrower | Loan Amount |
|---|---|---|---|
| Open | Balschunat Lisa | $146,800 |
Source: Public Records
Tax History Compared to Growth
Tax History
| Year | Tax Paid | Tax Assessment Tax Assessment Total Assessment is a certain percentage of the fair market value that is determined by local assessors to be the total taxable value of land and additions on the property. | Land | Improvement |
|---|---|---|---|---|
| 2024 | $3,846 | $138,600 | $10,400 | $128,200 |
| 2023 | $3,779 | $132,000 | $10,400 | $121,600 |
| 2022 | $3,417 | $132,000 | $10,400 | $121,600 |
| 2021 | $3,700 | $96,000 | $10,300 | $85,700 |
| 2020 | $3,679 | $96,000 | $10,300 | $85,700 |
| 2019 | $1,727 | $96,000 | $10,300 | $85,700 |
| 2018 | $1,727 | $96,000 | $10,300 | $85,700 |
| 2017 | $1,706 | $96,000 | $10,300 | $85,700 |
| 2016 | $3,475 | $96,000 | $10,300 | $85,700 |
| 2015 | -- | $96,000 | $10,300 | $85,700 |
| 2014 | -- | $96,000 | $10,300 | $85,700 |
Source: Public Records
Map
Nearby Homes
- 41 B Horicon Ave
- 41D Horion Ave
- 41 D Horicon Ave
- 41 C Horicon Ave
- 41 E Horicon Ave
- 41 F Horicon Ave
- 39 Horicon Ave
- 41 G Horicon Ave
- 41 Horicon Ave Unit G
- 41 Horicon Ave Unit B
- 41 Horicon Ave Unit F
- 41 Horicon Ave
- 41 Horicon Ave Unit I
- 41 Horicon Ave Unit H
- 41 Horicon Ave Unit E
- 41 Horicon Ave Unit D
- 41 Horicon Ave Unit K
- 41 Horicon Ave Unit J
- 41 Horicon Ave Unit A
- 41 Horicon Ave Unit I