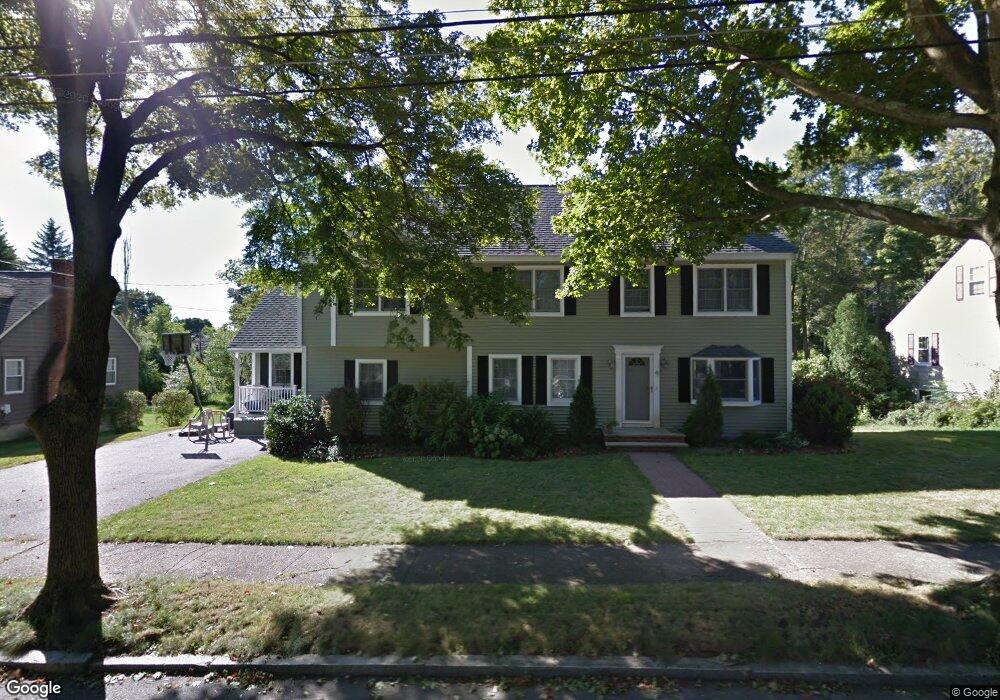
41 Aborn Ave Wakefield, MA 01880
Lakeside NeighborhoodEstimated Value: $911,000 - $1,214,320
6
Beds
4
Baths
4,434
Sq Ft
$245/Sq Ft
Est. Value
About This Home
This home is located at 41 Aborn Ave, Wakefield, MA 01880 and is currently estimated at $1,086,330, approximately $245 per square foot. 41 Aborn Ave is a home located in Middlesex County with nearby schools including Wakefield Memorial High School, St Joseph School, and Odyssey Day School.
Ownership History
Date
Name
Owned For
Owner Type
Purchase Details
Closed on
May 6, 1994
Sold by
Champagne Paul F and Champagne Ursula M
Bought by
Henning Douglas A and Stepp Maryellen
Current Estimated Value
Home Financials for this Owner
Home Financials are based on the most recent Mortgage that was taken out on this home.
Original Mortgage
$175,500
Interest Rate
7.7%
Mortgage Type
Purchase Money Mortgage
Create a Home Valuation Report for This Property
The Home Valuation Report is an in-depth analysis detailing your home's value as well as a comparison with similar homes in the area
Home Values in the Area
Average Home Value in this Area
Purchase History
| Date | Buyer | Sale Price | Title Company |
|---|---|---|---|
| Henning Douglas A | $195,000 | -- |
Source: Public Records
Mortgage History
| Date | Status | Borrower | Loan Amount |
|---|---|---|---|
| Open | Henning Douglas A | $197,600 | |
| Closed | Henning Douglas A | $175,500 | |
| Previous Owner | Henning Douglas A | $40,000 |
Source: Public Records
Tax History
| Year | Tax Paid | Tax Assessment Tax Assessment Total Assessment is a certain percentage of the fair market value that is determined by local assessors to be the total taxable value of land and additions on the property. | Land | Improvement |
|---|---|---|---|---|
| 2025 | $11,500 | $1,013,200 | $408,200 | $605,000 |
| 2024 | $11,611 | $1,032,100 | $415,900 | $616,200 |
| 2023 | $11,046 | $941,700 | $379,000 | $562,700 |
| 2022 | $10,286 | $834,900 | $335,400 | $499,500 |
| 2021 | $10,117 | $794,700 | $309,900 | $484,800 |
| 2020 | $9,400 | $736,100 | $287,100 | $449,000 |
| 2019 | $9,064 | $706,500 | $275,500 | $431,000 |
| 2018 | $8,617 | $665,400 | $259,500 | $405,900 |
| 2017 | $8,201 | $629,400 | $246,000 | $383,400 |
| 2016 | $7,527 | $558,000 | $225,200 | $332,800 |
| 2015 | $7,383 | $547,700 | $220,900 | $326,800 |
| 2014 | $6,592 | $515,800 | $212,400 | $303,400 |
Source: Public Records
Map
Nearby Homes
- 57 Wave Ave
- 29 Cordis St
- 16 Pleasant St
- 270 Lowell St
- 67 Woodcrest Dr
- 43-45 Crescent St
- 68 Preston St Unit 6D
- 10 Wakefield Ave Unit B
- 35 Richardson St Unit 2
- 39 Cedar St
- 62 Foundry St Unit 310
- 62 Foundry St Unit 204
- 62 Foundry St Unit 402
- 62 Foundry St Unit 507
- 62 Foundry St Unit 208
- 62 Foundry St Unit 414
- 62 Foundry St Unit 210
- 50 Quannapowitt Pkwy
- 1 Traverse St Unit E
- 69 Foundry St Unit 310
Your Personal Tour Guide
Ask me questions while you tour the home.