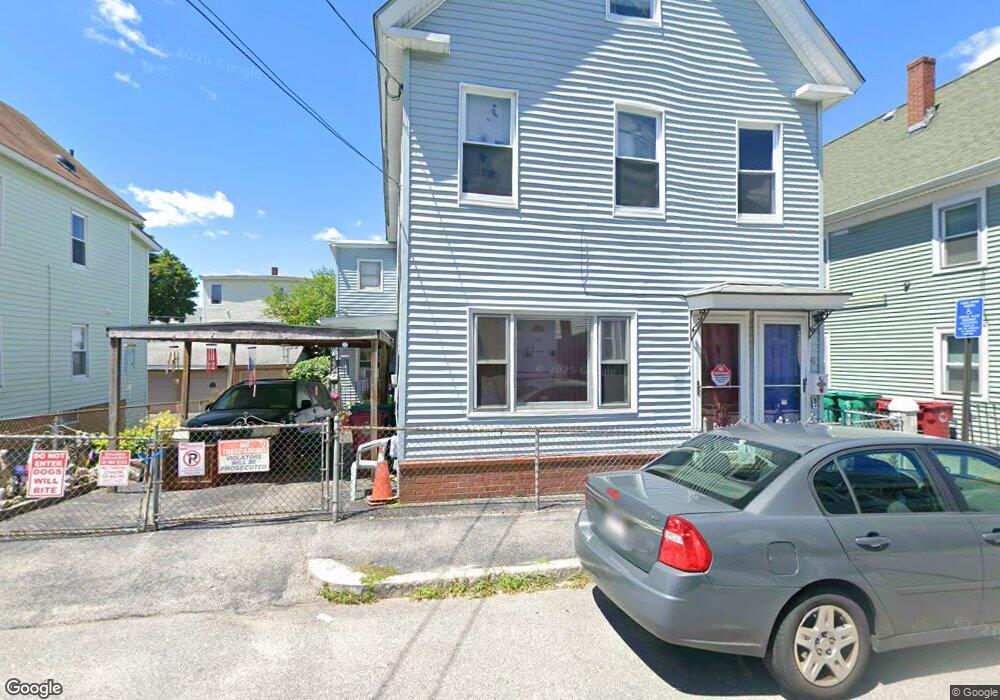
41 Agawam St Lowell, MA 01852
Sacred Heart NeighborhoodEstimated Value: $495,076 - $585,000
6
Beds
3
Baths
2,181
Sq Ft
$252/Sq Ft
Est. Value
About This Home
This home is located at 41 Agawam St, Lowell, MA 01852 and is currently estimated at $550,269, approximately $252 per square foot. 41 Agawam St is a home located in Middlesex County with nearby schools including Moody Elementary School, Abraham Lincoln Elementary School, and Greenhalge Elementary School.
Ownership History
Date
Name
Owned For
Owner Type
Purchase Details
Closed on
Dec 21, 2021
Sold by
Black Clara M
Bought by
Alexander Eugene H
Current Estimated Value
Purchase Details
Closed on
May 8, 1980
Bought by
Johnson Wallace L and Black Clara M
Create a Home Valuation Report for This Property
The Home Valuation Report is an in-depth analysis detailing your home's value as well as a comparison with similar homes in the area
Home Values in the Area
Average Home Value in this Area
Purchase History
| Date | Buyer | Sale Price | Title Company |
|---|---|---|---|
| Alexander Eugene H | -- | None Available | |
| Black Clara M | -- | None Available | |
| Alexander Eugene H | -- | None Available | |
| Johnson Wallace L | $41,500 | -- |
Source: Public Records
Mortgage History
| Date | Status | Borrower | Loan Amount |
|---|---|---|---|
| Previous Owner | Johnson Wallace L | $32,000 |
Source: Public Records
Tax History Compared to Growth
Tax History
| Year | Tax Paid | Tax Assessment Tax Assessment Total Assessment is a certain percentage of the fair market value that is determined by local assessors to be the total taxable value of land and additions on the property. | Land | Improvement |
|---|---|---|---|---|
| 2025 | $4,989 | $434,600 | $115,200 | $319,400 |
| 2024 | $4,602 | $386,400 | $103,900 | $282,500 |
| 2023 | $4,730 | $380,800 | $90,400 | $290,400 |
| 2022 | $4,241 | $334,200 | $71,300 | $262,900 |
| 2021 | $3,938 | $292,600 | $62,000 | $230,600 |
| 2020 | $3,532 | $264,400 | $51,600 | $212,800 |
| 2019 | $3,332 | $237,300 | $47,800 | $189,500 |
| 2018 | $3,101 | $215,500 | $45,500 | $170,000 |
| 2017 | $3,060 | $205,100 | $49,700 | $155,400 |
| 2016 | $3,112 | $205,300 | $49,900 | $155,400 |
| 2015 | $2,876 | $185,800 | $49,900 | $135,900 |
| 2013 | $2,612 | $174,000 | $57,600 | $116,400 |
Source: Public Records
Map
Nearby Homes
- 64 S Whipple St
- 5 Lenox St Unit 2
- 197 Moore St
- 14 Watson St Unit 4
- 96 Park Ave W Unit A4
- 540 Lawrence St
- 9 Watson St
- 15 Alton St Unit 10
- 59 Livingston St
- 46 Lyons St
- 35 Prospect St
- 762 Gorham St Unit 3
- 24 Richmond Ave
- 15 Whipple St
- 834 Central St
- 433 Lincoln St
- 8 Cedar Ct
- 43 Cedar St
- 42 Keene St
- 80 Rogers St Unit 304