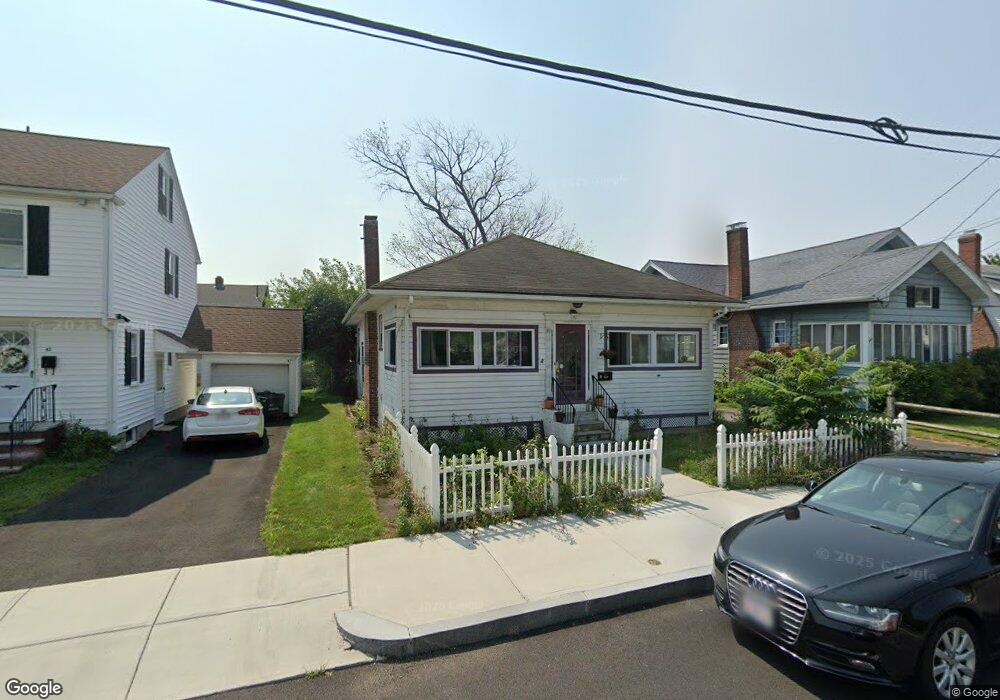
41 Albion Rd Quincy, MA 02170
Estimated Value: $645,501 - $689,000
3
Beds
2
Baths
1,160
Sq Ft
$576/Sq Ft
Est. Value
About This Home
This home is located at 41 Albion Rd, Quincy, MA 02170 and is currently estimated at $667,875, approximately $575 per square foot. 41 Albion Rd is a home located in Norfolk County with nearby schools including Francis W. Parker Elementary School, Atlantic Middle School, and North Quincy High School.
Ownership History
Date
Name
Owned For
Owner Type
Purchase Details
Closed on
Feb 1, 2006
Sold by
Nunez Evelyn and Perez Isabel
Bought by
Tran Dung L
Current Estimated Value
Home Financials for this Owner
Home Financials are based on the most recent Mortgage that was taken out on this home.
Original Mortgage
$270,000
Outstanding Balance
$157,263
Interest Rate
6.31%
Mortgage Type
Purchase Money Mortgage
Estimated Equity
$513,949
Purchase Details
Closed on
May 27, 1998
Sold by
Clifford Elizabeth
Bought by
Nunez Evelyn
Purchase Details
Closed on
Dec 3, 1996
Sold by
Tan Kenny
Bought by
Clifford Elizabeth
Purchase Details
Closed on
Jul 11, 1989
Sold by
Chow Sze H
Bought by
Tan Kenny
Create a Home Valuation Report for This Property
The Home Valuation Report is an in-depth analysis detailing your home's value as well as a comparison with similar homes in the area
Home Values in the Area
Average Home Value in this Area
Purchase History
| Date | Buyer | Sale Price | Title Company |
|---|---|---|---|
| Tran Dung L | $370,000 | -- | |
| Nunez Evelyn | $182,000 | -- | |
| Clifford Elizabeth | $149,000 | -- | |
| Tan Kenny | $142,000 | -- |
Source: Public Records
Mortgage History
| Date | Status | Borrower | Loan Amount |
|---|---|---|---|
| Open | Tan Kenny | $175,000 | |
| Open | Tran Dung L | $270,000 | |
| Previous Owner | Tan Kenny | $250,000 | |
| Previous Owner | Tan Kenny | $211,500 |
Source: Public Records
Tax History Compared to Growth
Tax History
| Year | Tax Paid | Tax Assessment Tax Assessment Total Assessment is a certain percentage of the fair market value that is determined by local assessors to be the total taxable value of land and additions on the property. | Land | Improvement |
|---|---|---|---|---|
| 2025 | $6,083 | $527,600 | $321,200 | $206,400 |
| 2024 | $5,914 | $524,800 | $321,200 | $203,600 |
| 2023 | $5,626 | $505,500 | $305,900 | $199,600 |
| 2022 | $5,284 | $441,100 | $244,700 | $196,400 |
| 2021 | $5,122 | $421,900 | $244,700 | $177,200 |
| 2020 | $5,042 | $405,600 | $244,700 | $160,900 |
| 2019 | $4,877 | $388,600 | $228,700 | $159,900 |
| 2018 | $4,700 | $352,300 | $207,900 | $144,400 |
| 2017 | $4,731 | $333,900 | $207,900 | $126,000 |
| 2016 | $4,398 | $306,300 | $189,000 | $117,300 |
| 2015 | $4,073 | $279,000 | $171,800 | $107,200 |
| 2014 | $3,923 | $264,000 | $163,600 | $100,400 |
Source: Public Records
Map
Nearby Homes
- 522 Hancock St
- 49 Vassall St
- 120 Holmes St Unit 309
- 120 Holmes St Unit 205
- 21 Linden St Unit 304
- 21 Linden St Unit 318
- 21 Linden St Unit 133
- 21 Linden St Unit 210
- 70 Hamilton St
- 42 Bromfield St
- 22 Beach St
- 143 Arlington St
- 7 Holmes St
- 204 Farrington St
- 1 Edwin St Unit C
- 98 Safford St
- 39 Fayette St Unit 102
- 85 E Squantum St Unit 10
- 677 Quincy Shore Dr Unit 207
- 180 Davis St