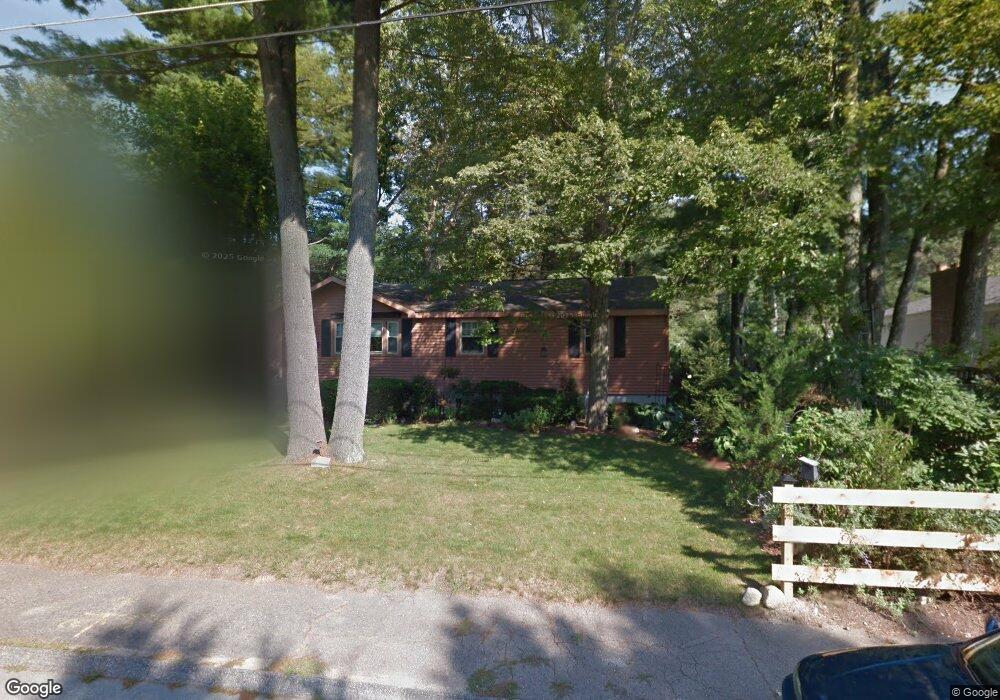
41 Apache Rd Bellingham, MA 02019
Estimated Value: $460,000 - $547,000
3
Beds
1
Bath
1,012
Sq Ft
$487/Sq Ft
Est. Value
About This Home
This home is located at 41 Apache Rd, Bellingham, MA 02019 and is currently estimated at $493,224, approximately $487 per square foot. 41 Apache Rd is a home located in Norfolk County with nearby schools including Stall Brook Elementary School, Bellingham High School, and Bethany Christian Academy.
Ownership History
Date
Name
Owned For
Owner Type
Purchase Details
Closed on
Nov 17, 2021
Sold by
Mulvey Carol A
Bought by
Carol Ann Mulvey Ft and Mulvey
Current Estimated Value
Purchase Details
Closed on
Aug 20, 2021
Sold by
Apache Rt and Mulvey
Bought by
Mulvey Carol A
Purchase Details
Closed on
Aug 1, 2006
Sold by
Mulvey Carol A and Mulvey Thomas F
Bought by
Apache Rt and Mulvey
Create a Home Valuation Report for This Property
The Home Valuation Report is an in-depth analysis detailing your home's value as well as a comparison with similar homes in the area
Home Values in the Area
Average Home Value in this Area
Purchase History
| Date | Buyer | Sale Price | Title Company |
|---|---|---|---|
| Carol Ann Mulvey Ft | -- | None Available | |
| Mulvey Carol A | -- | None Available | |
| Apache Rt | -- | -- |
Source: Public Records
Tax History
| Year | Tax Paid | Tax Assessment Tax Assessment Total Assessment is a certain percentage of the fair market value that is determined by local assessors to be the total taxable value of land and additions on the property. | Land | Improvement |
|---|---|---|---|---|
| 2025 | $4,582 | $364,800 | $166,600 | $198,200 |
| 2024 | $4,388 | $341,200 | $152,100 | $189,100 |
| 2023 | $4,231 | $324,200 | $144,900 | $179,300 |
| 2022 | $4,096 | $290,900 | $120,800 | $170,100 |
| 2021 | $4,065 | $282,100 | $120,800 | $161,300 |
| 2020 | $3,807 | $267,700 | $120,800 | $146,900 |
| 2019 | $3,726 | $262,200 | $120,800 | $141,400 |
| 2018 | $3,434 | $238,300 | $116,100 | $122,200 |
| 2017 | $3,348 | $233,500 | $116,100 | $117,400 |
| 2016 | $3,207 | $224,400 | $114,200 | $110,200 |
| 2015 | $3,075 | $215,800 | $109,800 | $106,000 |
| 2014 | $3,082 | $210,200 | $107,300 | $102,900 |
Source: Public Records
Map
Nearby Homes
- 8 Apache Rd
- 56 Puddingstone Ln
- 20 Hawthorne Village Unit A
- 462 Hartford Ave
- 21 Maple St
- 60 Pine St
- 18 Mary Anne Dr
- 4 Linda Ln
- 17 Pine St
- 394 Village St
- 3 Millbrook Rd
- 19 Sahlin Cir
- 1391 Pond St
- 22 Granite St
- 10 Franklin St
- 15 Fox Run Rd
- 6 Freedom Trail
- 22 Milford St
- 2 Kingson Ln Unit 2
- 10 Blue Jay St
Your Personal Tour Guide
Ask me questions while you tour the home.