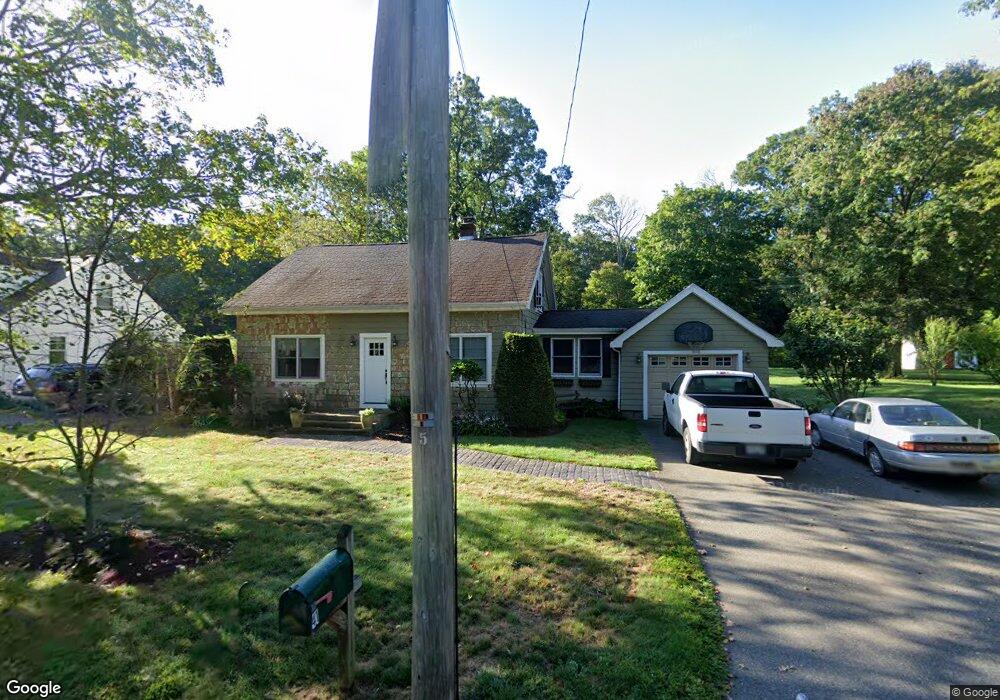
41 Archer St Wrentham, MA 02093
Estimated Value: $514,000 - $630,000
3
Beds
1
Bath
1,272
Sq Ft
$441/Sq Ft
Est. Value
About This Home
This home is located at 41 Archer St, Wrentham, MA 02093 and is currently estimated at $561,408, approximately $441 per square foot. 41 Archer St is a home located in Norfolk County with nearby schools including Delaney Elementary School, Charles E Roderick, and Discovery Daycare Center.
Ownership History
Date
Name
Owned For
Owner Type
Purchase Details
Closed on
Sep 5, 1996
Sold by
Carlson Richard M
Bought by
Moore Paul J and Moore Shana L
Current Estimated Value
Home Financials for this Owner
Home Financials are based on the most recent Mortgage that was taken out on this home.
Original Mortgage
$112,000
Interest Rate
8.11%
Mortgage Type
Purchase Money Mortgage
Create a Home Valuation Report for This Property
The Home Valuation Report is an in-depth analysis detailing your home's value as well as a comparison with similar homes in the area
Purchase History
| Date | Buyer | Sale Price | Title Company |
|---|---|---|---|
| Moore Paul J | $120,000 | -- |
Source: Public Records
Mortgage History
| Date | Status | Borrower | Loan Amount |
|---|---|---|---|
| Open | Moore Paul J | $113,500 | |
| Closed | Moore Paul J | $112,000 | |
| Closed | Moore Paul J | $112,000 |
Source: Public Records
Tax History
| Year | Tax Paid | Tax Assessment Tax Assessment Total Assessment is a certain percentage of the fair market value that is determined by local assessors to be the total taxable value of land and additions on the property. | Land | Improvement |
|---|---|---|---|---|
| 2025 | $5,592 | $482,500 | $255,600 | $226,900 |
| 2024 | $5,434 | $452,800 | $255,600 | $197,200 |
| 2023 | $5,062 | $401,100 | $223,800 | $177,300 |
| 2022 | $5,167 | $378,000 | $228,700 | $149,300 |
| 2021 | $4,861 | $345,500 | $203,500 | $142,000 |
| 2020 | $4,359 | $305,900 | $155,300 | $150,600 |
| 2019 | $4,109 | $291,000 | $147,900 | $143,100 |
| 2018 | $4,187 | $294,000 | $147,900 | $146,100 |
| 2017 | $3,956 | $277,600 | $145,100 | $132,500 |
| 2016 | $3,868 | $270,900 | $140,900 | $130,000 |
| 2015 | $3,741 | $249,700 | $135,400 | $114,300 |
| 2014 | $3,700 | $241,700 | $130,200 | $111,500 |
Source: Public Records
Map
Nearby Homes
- 10 Nature View Dr
- 15 Nature View Dr
- 500 Franklin St
- 2 Earle Stewart Ln
- 3 Earle Stewart Ln
- 12 Earle Stewart Ln
- 10 Earle Stewart Ln Unit Lot 5
- 287 Park St
- 246 Forest Grove Ave
- 50 Reed Fulton Ave Unit Lot 61
- 576 Dedham St
- 45 Joshua Rd
- 11 Weber Farm Rd Unit 11
- 8 Weber Farm Rd Unit 8
- 0 W Birch Rd
- 30 Weber Farm Rd Unit 30
- 8 Ridgefield Rd
- 9 Sharon Ave
- 11 Sharon Ave
- 25 Foxboro Rd
Your Personal Tour Guide
Ask me questions while you tour the home.