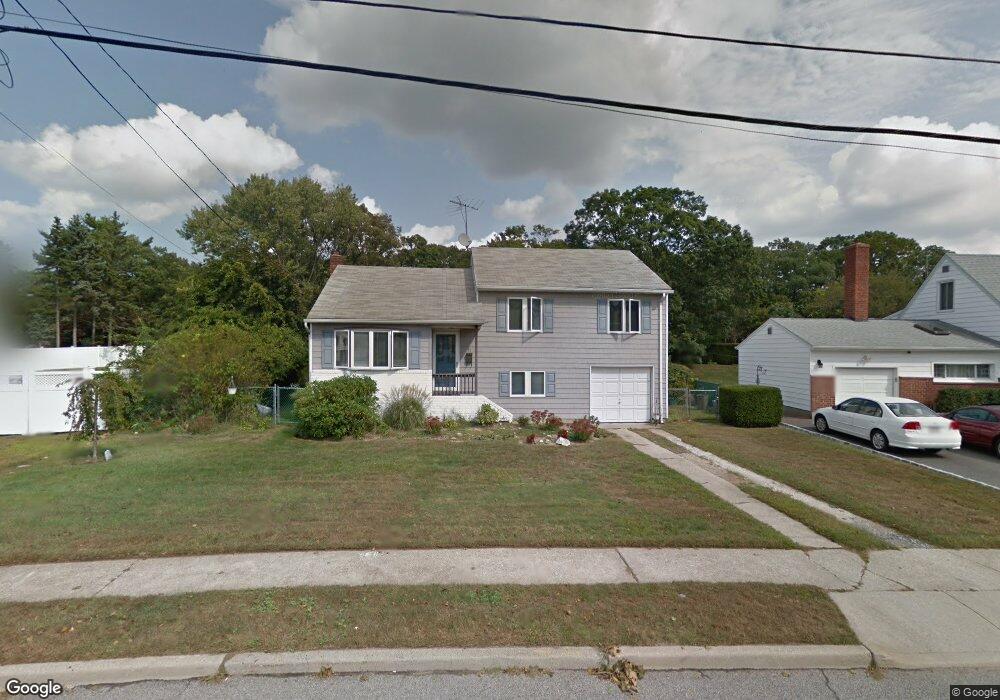
41 Armon Dr Bethpage, NY 11714
Estimated Value: $755,691 - $802,000
3
Beds
3
Baths
1,415
Sq Ft
$550/Sq Ft
Est. Value
About This Home
This home is located at 41 Armon Dr, Bethpage, NY 11714 and is currently estimated at $778,846, approximately $550 per square foot. 41 Armon Dr is a home located in Nassau County with nearby schools including Charles Campagne Elementary School, John F Kennedy Middle School, and Bethpage Senior High School.
Ownership History
Date
Name
Owned For
Owner Type
Purchase Details
Closed on
May 26, 2021
Sold by
Giersbach Trust
Bought by
Persad Nicole and Persad Nyron
Current Estimated Value
Home Financials for this Owner
Home Financials are based on the most recent Mortgage that was taken out on this home.
Original Mortgage
$488,750
Interest Rate
2.9%
Mortgage Type
New Conventional
Purchase Details
Closed on
Dec 19, 2017
Sold by
Giersbach Elaine
Bought by
Giersbach Gary
Create a Home Valuation Report for This Property
The Home Valuation Report is an in-depth analysis detailing your home's value as well as a comparison with similar homes in the area
Home Values in the Area
Average Home Value in this Area
Purchase History
| Date | Buyer | Sale Price | Title Company |
|---|---|---|---|
| Persad Nicole | $575,000 | First American Title | |
| Giersbach Gary | -- | -- |
Source: Public Records
Mortgage History
| Date | Status | Borrower | Loan Amount |
|---|---|---|---|
| Previous Owner | Persad Nicole | $488,750 |
Source: Public Records
Tax History
| Year | Tax Paid | Tax Assessment Tax Assessment Total Assessment is a certain percentage of the fair market value that is determined by local assessors to be the total taxable value of land and additions on the property. | Land | Improvement |
|---|---|---|---|---|
| 2025 | $12,925 | $463 | $292 | $171 |
| 2024 | $4,283 | $449 | $283 | $166 |
Source: Public Records
Map
Nearby Homes
Your Personal Tour Guide
Ask me questions while you tour the home.