41 Barnes Dr Garnerville, NY 10923
Estimated Value: $664,000 - $692,147
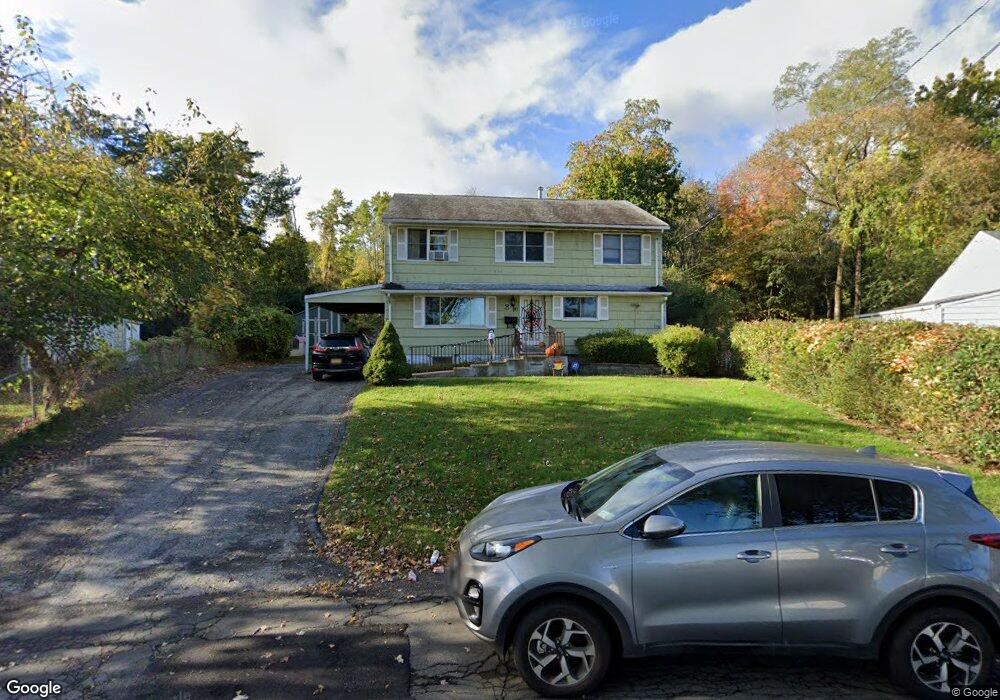
About This Home
This home is located at 41 Barnes Dr, Garnerville, NY 10923 and is currently estimated at $674,787, approximately $279 per square foot. 41 Barnes Dr is a home located in Rockland County with nearby schools including West Haverstraw Elementary School, Haverstraw Elementary School, and Fieldstone Secondary School.
Ownership History
We collect this data history from publicly available records. To have your information removed, we recommend requesting removal directly through your county’s website.
Purchase Details
Home Financials for this Owner
Home Financials are based on the most recent Mortgage that was taken out on this home.Home Values in the Area
Average Home Value in this Area
Purchase History
We collect this data history from publicly available records. To have your information removed, we recommend requesting removal directly through your county’s website.
| Date | Buyer | Sale Price | Title Company |
|---|---|---|---|
| $300,000 | Sonia Crannage | ||
| $300,000 | None Available |
Mortgage History
We collect this data history from publicly available records. To have your information removed, we recommend requesting removal directly through your county’s website.
| Date | Status | Borrower | Loan Amount |
|---|---|---|---|
| Open | $268,000 | ||
| Closed | $268,000 |
Tax History
We collect this data history from publicly available records. To have your information removed, we recommend requesting removal directly through your county’s website.
| Year | Tax Paid | Tax Assessment Tax Assessment Total Assessment is a certain percentage of the fair market value that is determined by local assessors to be the total taxable value of land and additions on the property. | Land | Improvement |
|---|---|---|---|---|
| 2024 | $18,107 | $256,500 | $135,900 | $120,600 |
| 2023 | $18,107 | $256,500 | $135,900 | $120,600 |
| 2022 | $2,427 | $256,500 | $135,900 | $120,600 |
| 2021 | $17,889 | $256,500 | $135,900 | $120,600 |
| 2020 | $12,222 | $256,500 | $135,900 | $120,600 |
| 2019 | $2,657 | $256,500 | $135,900 | $120,600 |
| 2018 | $11,816 | $256,500 | $135,900 | $120,600 |
| 2017 | $11,084 | $256,500 | $135,900 | $120,600 |
| 2016 | $11,088 | $256,500 | $135,900 | $120,600 |
| 2015 | -- | $256,500 | $135,900 | $120,600 |
| 2014 | -- | $256,500 | $135,900 | $120,600 |
Map
- 87 Capt Shankey Dr
- 67 Capt Shankey Dr
- 8 Caruso Ct
- 54 Capt Shankey Dr
- 1 Havervale Ln
- 6 Crescent Dr Unit 23
- 23 Crescent Dr Unit 90
- 5 Crescent Dr Unit 17
- 29 Ramapo Rd
- 21 Capt Shankey Dr
- 36 Suffern Ln
- 14 Bubenko Ln
- 93 Main St
- 8 Lynch Ct
- 25 Rosman Rd
- 84 Main St
- 39 Bubenko Dr
- 17 Sherman Dr
- 12 Sand St
- 22 High St
Ask me questions while you tour the home.