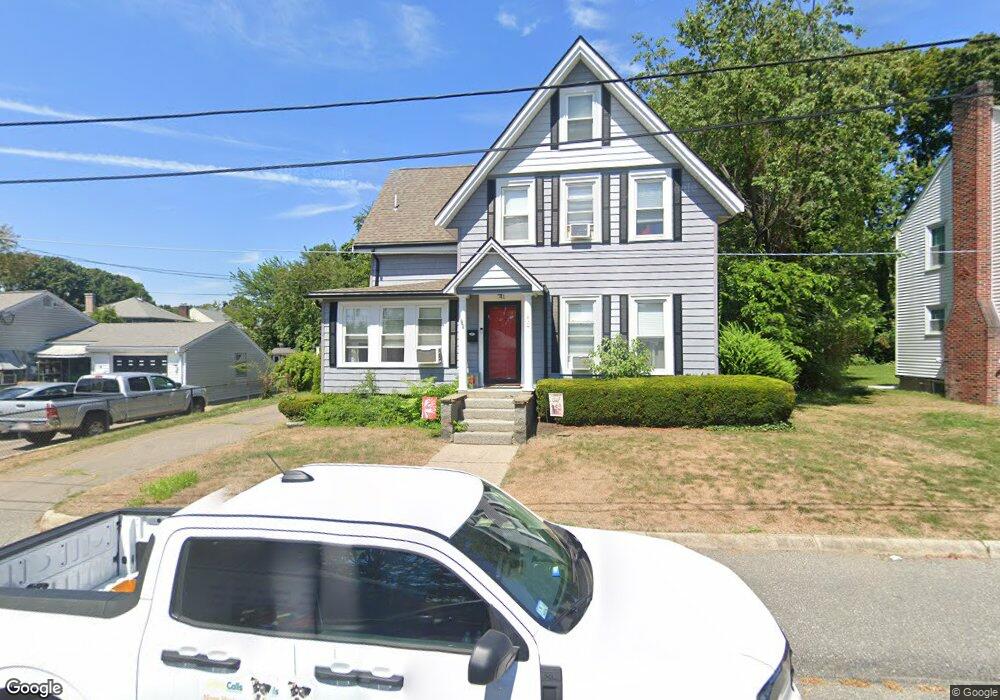
41 Barry St Quincy, MA 02169
South Quincy NeighborhoodEstimated Value: $688,000 - $766,000
3
Beds
2
Baths
1,422
Sq Ft
$514/Sq Ft
Est. Value
About This Home
This home is located at 41 Barry St, Quincy, MA 02169 and is currently estimated at $730,697, approximately $513 per square foot. 41 Barry St is a home located in Norfolk County with nearby schools including South West Middle School, Lincoln-Hancock Community School, and Quincy High School.
Ownership History
Date
Name
Owned For
Owner Type
Purchase Details
Closed on
Aug 30, 2002
Sold by
Murphy Jsoephine F
Bought by
Morgan Christopher J and Morgan Norita M
Current Estimated Value
Home Financials for this Owner
Home Financials are based on the most recent Mortgage that was taken out on this home.
Original Mortgage
$263,200
Outstanding Balance
$112,431
Interest Rate
6.55%
Mortgage Type
Purchase Money Mortgage
Estimated Equity
$618,266
Create a Home Valuation Report for This Property
The Home Valuation Report is an in-depth analysis detailing your home's value as well as a comparison with similar homes in the area
Home Values in the Area
Average Home Value in this Area
Purchase History
| Date | Buyer | Sale Price | Title Company |
|---|---|---|---|
| Morgan Christopher J | $329,000 | -- |
Source: Public Records
Mortgage History
| Date | Status | Borrower | Loan Amount |
|---|---|---|---|
| Open | Morgan Christopher J | $263,200 |
Source: Public Records
Tax History Compared to Growth
Tax History
| Year | Tax Paid | Tax Assessment Tax Assessment Total Assessment is a certain percentage of the fair market value that is determined by local assessors to be the total taxable value of land and additions on the property. | Land | Improvement |
|---|---|---|---|---|
| 2025 | $7,219 | $626,100 | $324,400 | $301,700 |
| 2024 | $6,760 | $599,800 | $309,600 | $290,200 |
| 2023 | $6,349 | $570,400 | $295,500 | $274,900 |
| 2022 | $6,149 | $513,300 | $238,800 | $274,500 |
| 2021 | $5,800 | $477,800 | $238,800 | $239,000 |
| 2020 | $5,710 | $459,400 | $238,800 | $220,600 |
| 2019 | $5,525 | $440,200 | $232,300 | $207,900 |
| 2018 | $5,376 | $403,000 | $216,000 | $187,000 |
| 2017 | $5,376 | $379,400 | $206,300 | $173,100 |
| 2016 | $5,015 | $349,200 | $188,700 | $160,500 |
| 2015 | $4,749 | $325,300 | $178,700 | $146,600 |
| 2014 | $4,627 | $311,400 | $178,700 | $132,700 |
Source: Public Records
Map
Nearby Homes
- 211 Copeland St
- 1 Cityview Ln Unit 506
- 1 Cityview Ln Unit 210
- 1 Cityview Ln Unit 709
- 73 Connell St
- 25 Carrolls Ln
- 10 White St
- 46 Suomi Rd
- 46 Suomi Rd Unit 46
- 46-48 Buckley St
- 57 Buckley St
- 42 West St
- 14 Arthur Ave
- 12 Arthur Ave
- 89 Puritan Dr
- 510 Willard St
- 21 Arthur St
- 91 Garfield St
- 66 Unity St
- 29 Oconnell Ave