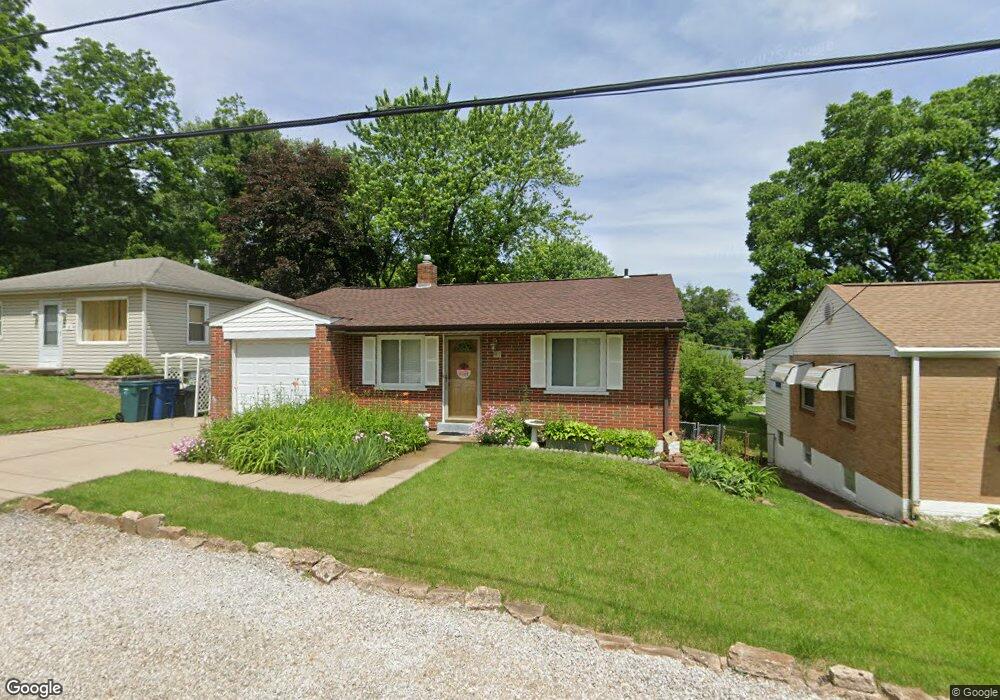
41 Bascom Dr Saint Louis, MO 63135
Estimated Value: $111,010 - $130,000
3
Beds
1
Bath
1,115
Sq Ft
$106/Sq Ft
Est. Value
About This Home
This home is located at 41 Bascom Dr, Saint Louis, MO 63135 and is currently estimated at $118,503, approximately $106 per square foot. 41 Bascom Dr is a home located in St. Louis County with nearby schools including Walnut Grove Elementary School, Ferguson Middle School, and McCluer High School.
Ownership History
Date
Name
Owned For
Owner Type
Purchase Details
Closed on
Apr 20, 2024
Sold by
Byrn Valerie A and Oren Jesse
Bought by
Oren Jesse and Byrn-Oren Valerie A
Current Estimated Value
Purchase Details
Closed on
Mar 19, 2003
Sold by
Byrn Valerie A
Bought by
Byrn Jane L and Byrn Leah E
Purchase Details
Closed on
Oct 10, 2002
Sold by
Matrix Financial Services Corp
Bought by
Hud
Purchase Details
Closed on
Sep 27, 2002
Sold by
Clarice Paul and Clarice Cynthia M
Bought by
Byrn Valerie A
Purchase Details
Closed on
Jul 12, 2002
Sold by
Hud
Bought by
Clarice Paul
Home Financials for this Owner
Home Financials are based on the most recent Mortgage that was taken out on this home.
Original Mortgage
$30,000
Interest Rate
6.69%
Purchase Details
Closed on
Nov 15, 2001
Sold by
Mortgage Electronic Registration
Bought by
Hud
Purchase Details
Closed on
Apr 19, 2001
Sold by
Gerard Piros and Gerard Madonna A
Bought by
Mortgage Electronic Registration
Purchase Details
Closed on
Aug 4, 1998
Sold by
Piros Madonna A and Piros Madonna
Bought by
Piros Gerard
Create a Home Valuation Report for This Property
The Home Valuation Report is an in-depth analysis detailing your home's value as well as a comparison with similar homes in the area
Home Values in the Area
Average Home Value in this Area
Purchase History
| Date | Buyer | Sale Price | Title Company |
|---|---|---|---|
| Oren Jesse | -- | None Listed On Document | |
| Byrn Jane L | -- | -- | |
| Hud | -- | -- | |
| Byrn Valerie A | $70,000 | -- | |
| Clarice Paul | -- | -- | |
| Hud | $47,095 | -- | |
| Mortgage Electronic Registration | $47,095 | -- | |
| Piros Gerard | -- | -- |
Source: Public Records
Mortgage History
| Date | Status | Borrower | Loan Amount |
|---|---|---|---|
| Previous Owner | Clarice Paul | $30,000 |
Source: Public Records
Tax History
| Year | Tax Paid | Tax Assessment Tax Assessment Total Assessment is a certain percentage of the fair market value that is determined by local assessors to be the total taxable value of land and additions on the property. | Land | Improvement |
|---|---|---|---|---|
| 2025 | $1,279 | $21,930 | $1,960 | $19,970 |
| 2024 | $1,279 | $16,170 | $780 | $15,390 |
| 2023 | $1,279 | $16,170 | $780 | $15,390 |
| 2022 | $1,145 | $12,720 | $2,360 | $10,360 |
| 2021 | $1,141 | $12,720 | $2,360 | $10,360 |
| 2020 | $1,115 | $11,560 | $1,580 | $9,980 |
| 2019 | $1,094 | $11,560 | $1,580 | $9,980 |
| 2018 | $1,172 | $11,120 | $1,240 | $9,880 |
| 2017 | $1,166 | $11,120 | $1,240 | $9,880 |
| 2016 | $1,314 | $12,240 | $2,000 | $10,240 |
| 2015 | $1,321 | $12,240 | $2,000 | $10,240 |
| 2014 | -- | $11,930 | $2,010 | $9,920 |
Source: Public Records
Map
Nearby Homes
- 25 Vierling Dr
- 181 Bascom Dr
- 194 Elbring Dr
- 135 Grether Ave
- 13 Barto Dr
- 18 White Dr
- 16 White Dr
- 1825 S New Florissant Rd
- 201 Becker Dr
- 968 Buckeye Dr
- 1815 S New Florissant Rd
- 215 Ryan Ave
- 273 Buddie Ave
- 242 Connolly Dr
- 233 Connolly Dr
- 6801 Knoll Ave
- 211 Frost Ave
- 6717 Thurston Ave
- 11 S Duchesne Dr
- 6637 Torlina Dr
Your Personal Tour Guide
Ask me questions while you tour the home.