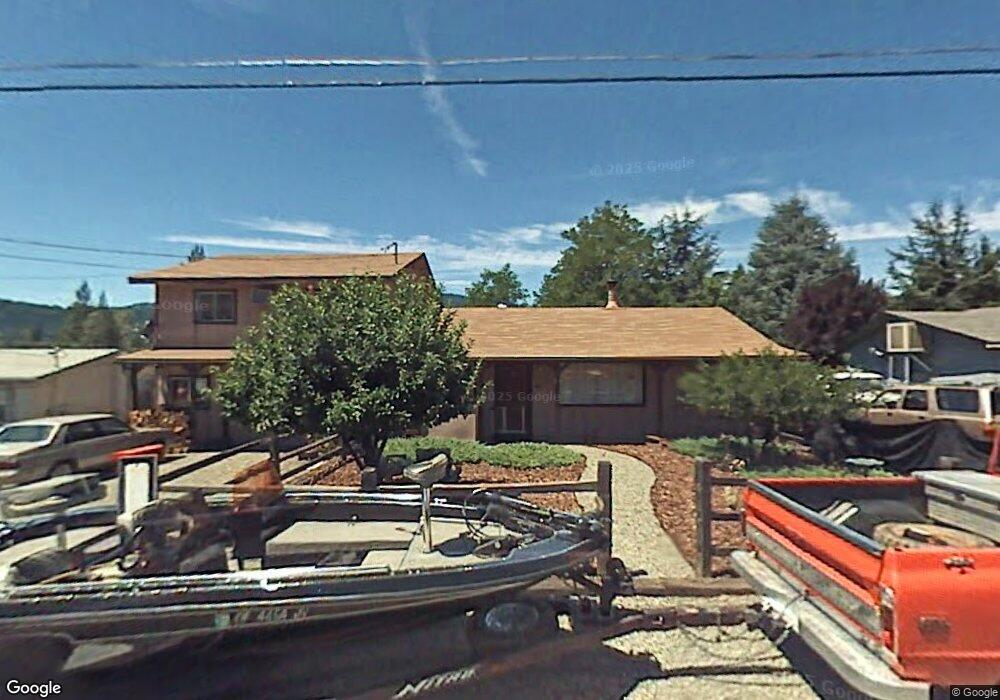
41 Bennett Rd Weaverville, CA 96093
Estimated Value: $205,000 - $398,000
2
Beds
2
Baths
1,750
Sq Ft
$165/Sq Ft
Est. Value
About This Home
This home is located at 41 Bennett Rd, Weaverville, CA 96093 and is currently estimated at $288,650, approximately $164 per square foot. 41 Bennett Rd is a home with nearby schools including Weaverville Elementary School and Trinity High School.
Ownership History
Date
Name
Owned For
Owner Type
Purchase Details
Closed on
Dec 4, 2019
Sold by
Roszell Charmaine Marie
Bought by
Roszell Charmaine Marie
Current Estimated Value
Purchase Details
Closed on
Dec 3, 2019
Sold by
Roszell Zachary James and Roszell Zachary James
Bought by
Rozell Charmaine Marie
Purchase Details
Closed on
Apr 23, 2010
Sold by
Roszell Zachary James
Bought by
Roszell Zachary James
Purchase Details
Closed on
Oct 4, 2004
Sold by
Roszell Charmaine Marie
Bought by
Revoca Roszell Charmaine Marie
Create a Home Valuation Report for This Property
The Home Valuation Report is an in-depth analysis detailing your home's value as well as a comparison with similar homes in the area
Home Values in the Area
Average Home Value in this Area
Purchase History
| Date | Buyer | Sale Price | Title Company |
|---|---|---|---|
| Roszell Charmaine Marie | -- | Trinity Co Title Co | |
| Roszell Charmaine Marie | -- | Trinity Co Title Co | |
| Rozell Charmaine Marie | -- | Trinity Co Title Co | |
| Roszell Zachary James | -- | None Available | |
| Roszell Zachary James | -- | None Available | |
| Revoca Roszell Charmaine Marie | -- | -- |
Source: Public Records
Tax History
| Year | Tax Paid | Tax Assessment Tax Assessment Total Assessment is a certain percentage of the fair market value that is determined by local assessors to be the total taxable value of land and additions on the property. | Land | Improvement |
|---|---|---|---|---|
| 2025 | $1,287 | $114,077 | $5,663 | $108,414 |
| 2024 | $1,285 | $111,841 | $5,552 | $106,289 |
| 2023 | $1,285 | $109,649 | $5,444 | $104,205 |
| 2022 | $1,255 | $107,500 | $5,338 | $102,162 |
| 2021 | $1,232 | $105,393 | $5,234 | $100,159 |
| 2020 | $1,187 | $104,313 | $5,181 | $99,132 |
| 2019 | $1,126 | $102,269 | $5,080 | $97,189 |
| 2018 | $1,126 | $100,265 | $4,981 | $95,284 |
| 2017 | $1,125 | $98,300 | $4,884 | $93,416 |
| 2016 | $1,083 | $96,374 | $4,789 | $91,585 |
| 2015 | $1,070 | $94,928 | $4,718 | $90,210 |
| 2014 | $1,052 | $93,069 | $4,626 | $88,443 |
Source: Public Records
Map
Nearby Homes
- 125 Old Orchard
- 230 Shasta Springs Rd
- 50,60,80 Masonic
- 1081 Main St
- 140 Masonic Ln
- 230 Shasta Springs
- 56 Horseshoe Ln
- 231 Fairway Dr
- 195 Mill St
- 220 Fairway Dr
- 401 Mountain View St
- 331 Fairway Dr
- 221 Davis Rd
- 60 Mulligan St
- 506 Masonic Ln
- 30920 California 3
- 30 Paulsen St
- 138 Sam Lee Dr
- 138 Sam Lee St
- 493 Main St
Your Personal Tour Guide
Ask me questions while you tour the home.