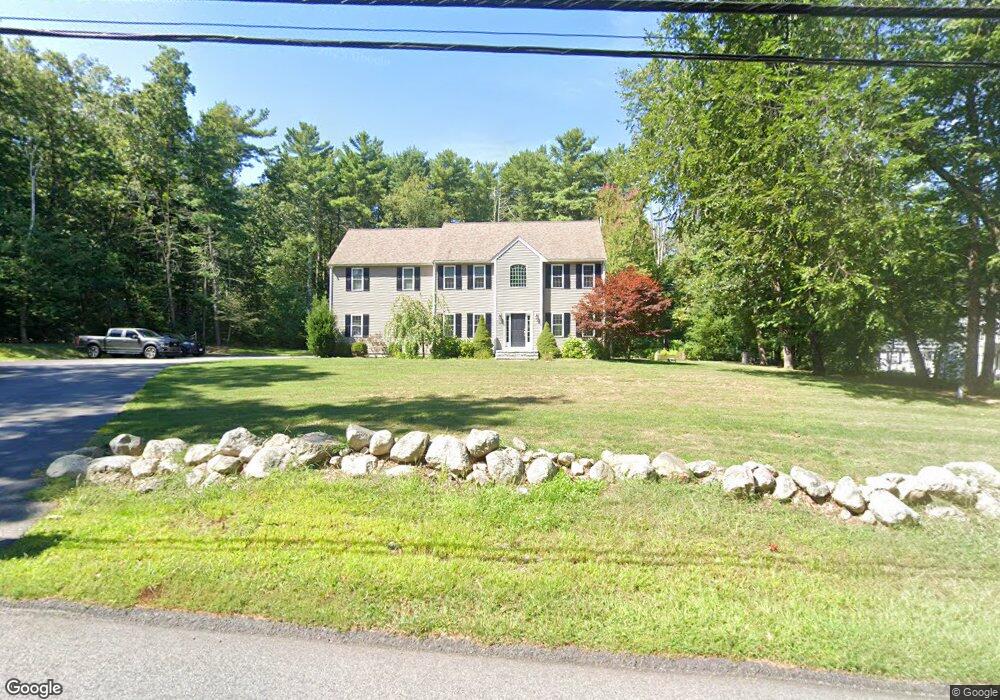
41 Bowker St Norwell, MA 02061
Estimated Value: $1,044,000 - $1,139,000
4
Beds
3
Baths
2,062
Sq Ft
$538/Sq Ft
Est. Value
About This Home
This home is located at 41 Bowker St, Norwell, MA 02061 and is currently estimated at $1,108,541, approximately $537 per square foot. 41 Bowker St is a home with nearby schools including Grace Farrar Cole Elementary School, Norwell Middle School, and Norwell High School.
Ownership History
Date
Name
Owned For
Owner Type
Purchase Details
Closed on
Jul 2, 2019
Sold by
Stratford James J and Stratford Heather J
Bought by
Fisher Candice S and Fisher Jason M
Current Estimated Value
Home Financials for this Owner
Home Financials are based on the most recent Mortgage that was taken out on this home.
Original Mortgage
$250,000
Outstanding Balance
$217,663
Interest Rate
3.73%
Mortgage Type
New Conventional
Estimated Equity
$890,878
Purchase Details
Closed on
Oct 11, 2013
Sold by
Lennox Rt and Johnson
Bought by
Stratford James J and Stratford Heather J
Create a Home Valuation Report for This Property
The Home Valuation Report is an in-depth analysis detailing your home's value as well as a comparison with similar homes in the area
Home Values in the Area
Average Home Value in this Area
Purchase History
| Date | Buyer | Sale Price | Title Company |
|---|---|---|---|
| Fisher Candice S | $710,000 | -- | |
| Fisher Candice S | $710,000 | -- | |
| Stratford James J | $271,000 | -- | |
| Stratford James J | $271,000 | -- |
Source: Public Records
Mortgage History
| Date | Status | Borrower | Loan Amount |
|---|---|---|---|
| Open | Fisher Candice S | $250,000 | |
| Closed | Fisher Candice S | $250,000 |
Source: Public Records
Tax History
| Year | Tax Paid | Tax Assessment Tax Assessment Total Assessment is a certain percentage of the fair market value that is determined by local assessors to be the total taxable value of land and additions on the property. | Land | Improvement |
|---|---|---|---|---|
| 2025 | $13,392 | $1,024,600 | $393,800 | $630,800 |
| 2024 | $12,619 | $937,500 | $371,600 | $565,900 |
| 2023 | $12,238 | $800,400 | $285,800 | $514,600 |
| 2022 | $11,667 | $702,000 | $248,300 | $453,700 |
| 2021 | $11,150 | $658,200 | $261,400 | $396,800 |
| 2020 | $10,778 | $648,100 | $261,400 | $386,700 |
| 2019 | $10,148 | $618,800 | $261,400 | $357,400 |
| 2018 | $9,763 | $597,500 | $261,400 | $336,100 |
| 2017 | $9,883 | $600,800 | $261,400 | $339,400 |
| 2016 | $9,587 | $581,000 | $261,400 | $319,600 |
| 2015 | $6,021 | $364,900 | $261,400 | $103,500 |
| 2014 | $4,595 | $280,700 | $260,700 | $20,000 |
Source: Public Records
Map
Nearby Homes
- 164 Main St
- Lot 24 Webster Farm Way
- Lot 1 Webster Farm Way
- Lot 4 Webster Farm Way
- Lot 22 Webster Farm Way
- Lot 26 Webster Farm Way
- 451 Main St
- 56 Paradise Dr
- 179 Lincoln St
- 720 Grove St
- 7 Assinippi Ave Unit 205
- 7 Assinippi Ave Unit 306
- 225 Prospect St
- 166 Norwell Ave
- 0 Mount Blue St
- 251 Prospect St
- 53 Chestnut St
- 49 Washington Park Dr
- 0 Mt Blue Unit 73374335
- 535 Webster St
Your Personal Tour Guide
Ask me questions while you tour the home.