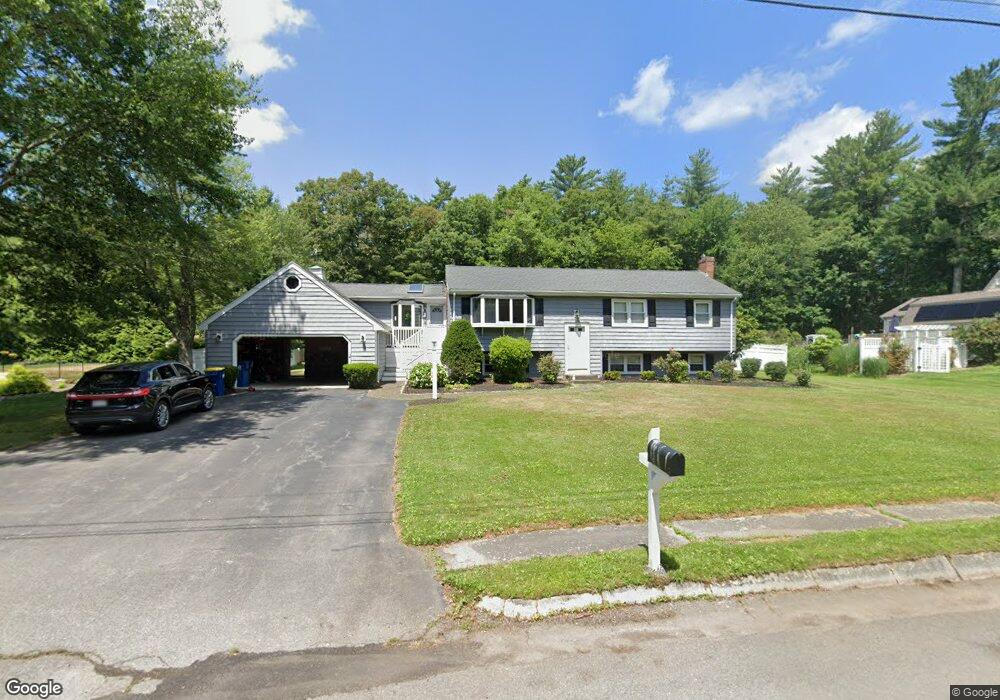
41 Branch Rd East Bridgewater, MA 02333
Estimated Value: $595,000 - $900,000
4
Beds
2
Baths
2,200
Sq Ft
$325/Sq Ft
Est. Value
About This Home
This home is located at 41 Branch Rd, East Bridgewater, MA 02333 and is currently estimated at $714,719, approximately $324 per square foot. 41 Branch Rd is a home located in Plymouth County with nearby schools including Central Elementary School, Gordon W Mitchell Middle School, and East Bridgewater Jr./Sr. High School.
Ownership History
Date
Name
Owned For
Owner Type
Purchase Details
Closed on
Feb 4, 2020
Sold by
Mark F Geden T
Bought by
Matthew M Geden Irt
Current Estimated Value
Purchase Details
Closed on
Jun 3, 2010
Sold by
Geden Mark F
Bought by
Mark F Geden T
Purchase Details
Closed on
Feb 4, 2009
Sold by
Muise Timothy P
Bought by
Geden Mark F
Home Financials for this Owner
Home Financials are based on the most recent Mortgage that was taken out on this home.
Original Mortgage
$244,000
Interest Rate
5.2%
Mortgage Type
Purchase Money Mortgage
Purchase Details
Closed on
Jul 1, 2004
Sold by
Duffy Claire and Duffy Claire A
Bought by
Muise Timothy P
Purchase Details
Closed on
Nov 30, 2000
Sold by
Teehan Edward D and Teehan Helen M
Bought by
Duffy Claire
Purchase Details
Closed on
Aug 1, 1989
Sold by
Mccarthy Robert S
Bought by
Teehan Edward D
Create a Home Valuation Report for This Property
The Home Valuation Report is an in-depth analysis detailing your home's value as well as a comparison with similar homes in the area
Home Values in the Area
Average Home Value in this Area
Purchase History
| Date | Buyer | Sale Price | Title Company |
|---|---|---|---|
| Matthew M Geden Irt | -- | None Available | |
| Mark F Geden T | -- | -- | |
| Geden Mark F | $305,000 | -- | |
| Muise Timothy P | $422,500 | -- | |
| Duffy Claire | $249,900 | -- | |
| Teehan Edward D | $182,000 | -- |
Source: Public Records
Mortgage History
| Date | Status | Borrower | Loan Amount |
|---|---|---|---|
| Previous Owner | Teehan Edward D | $155,000 | |
| Previous Owner | Teehan Edward D | $244,000 |
Source: Public Records
Tax History Compared to Growth
Tax History
| Year | Tax Paid | Tax Assessment Tax Assessment Total Assessment is a certain percentage of the fair market value that is determined by local assessors to be the total taxable value of land and additions on the property. | Land | Improvement |
|---|---|---|---|---|
| 2025 | $7,952 | $581,700 | $211,400 | $370,300 |
| 2024 | $7,745 | $559,600 | $203,300 | $356,300 |
| 2023 | $7,580 | $524,600 | $203,300 | $321,300 |
| 2022 | $7,036 | $451,000 | $169,500 | $281,500 |
| 2021 | $6,754 | $396,100 | $162,800 | $233,300 |
| 2020 | $6,589 | $381,100 | $156,600 | $224,500 |
| 2019 | $6,441 | $366,800 | $149,700 | $217,100 |
| 2018 | $6,279 | $349,600 | $149,700 | $199,900 |
| 2017 | $6,098 | $333,200 | $142,700 | $190,500 |
| 2016 | $5,920 | $326,000 | $142,700 | $183,300 |
| 2015 | $5,763 | $324,500 | $141,700 | $182,800 |
| 2014 | $5,635 | $324,400 | $138,800 | $185,600 |
Source: Public Records
Map
Nearby Homes
- 1247 Central St
- 936 Central St
- 5 Della Way
- 844 Washington St
- 9 Daisy Ln
- 1 Simmons Place
- 182 Crystal Water Dr Unit 182
- 217 Crystal Water Dr
- 28 Brookbend Way E
- 170 Elm St
- 78 Crystal Water Dr
- 51 Stonegate Dr
- 587 Bridge St
- 1993 Washington St
- 71 Stonegate Dr
- 26 Meadowbrook Dr
- 2045 Washington St
- 14 Mountain Ash Rd
- 94 Pond St
- 22 Hudson St