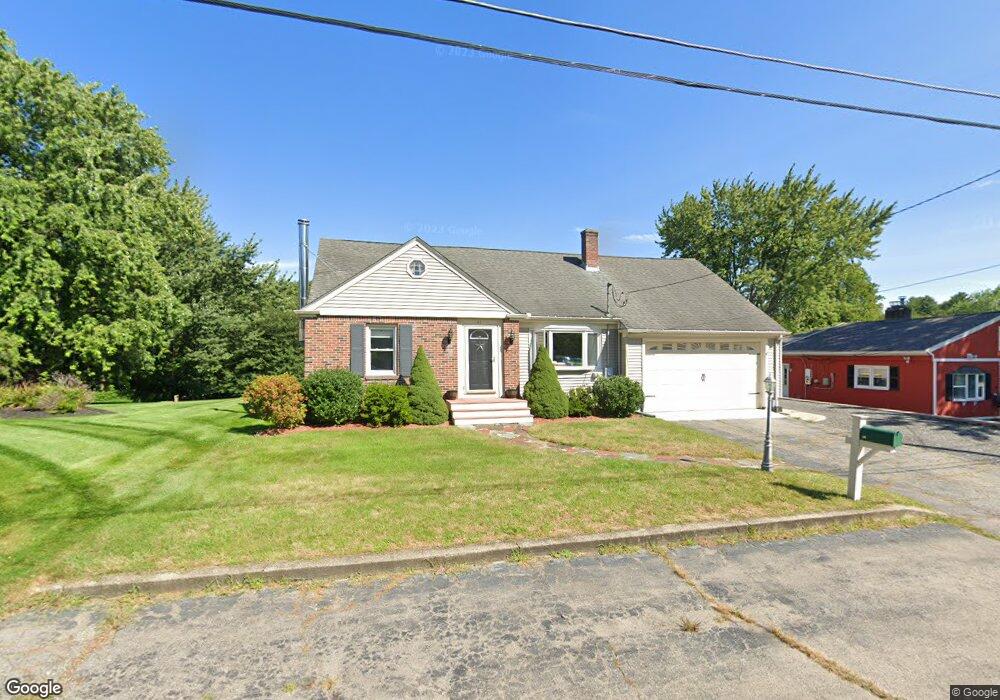
41 Brisson St Bellingham, MA 02019
Estimated Value: $527,886 - $604,000
2
Beds
1
Bath
2,196
Sq Ft
$256/Sq Ft
Est. Value
About This Home
This home is located at 41 Brisson St, Bellingham, MA 02019 and is currently estimated at $561,472, approximately $255 per square foot. 41 Brisson St is a home located in Norfolk County with nearby schools including Joseph F. DiPietro Elementary, Bellingham High School, and Rise Prep Mayoral Academy Middle School.
Ownership History
Date
Name
Owned For
Owner Type
Purchase Details
Closed on
Dec 8, 2010
Sold by
Collins Michelle C and Andre Michelle C
Bought by
Andre Michelle C and Andre Jason E
Current Estimated Value
Home Financials for this Owner
Home Financials are based on the most recent Mortgage that was taken out on this home.
Original Mortgage
$247,450
Outstanding Balance
$164,729
Interest Rate
4.37%
Mortgage Type
FHA
Estimated Equity
$396,743
Purchase Details
Closed on
Sep 30, 1997
Sold by
Walsh Kenneth J
Bought by
Collins Daniel R and Collins Michelle C
Home Financials for this Owner
Home Financials are based on the most recent Mortgage that was taken out on this home.
Original Mortgage
$120,650
Interest Rate
7.47%
Mortgage Type
Purchase Money Mortgage
Purchase Details
Closed on
May 28, 1993
Sold by
Brisson Laurette
Bought by
Walsh Kenneth J and Walsh Deborah A
Create a Home Valuation Report for This Property
The Home Valuation Report is an in-depth analysis detailing your home's value as well as a comparison with similar homes in the area
Home Values in the Area
Average Home Value in this Area
Purchase History
| Date | Buyer | Sale Price | Title Company |
|---|---|---|---|
| Andre Michelle C | -- | -- | |
| Collins Daniel R | $127,000 | -- | |
| Collins Daniel R | $127,000 | -- | |
| Walsh Kenneth J | $108,000 | -- | |
| Walsh Kenneth J | $108,000 | -- |
Source: Public Records
Mortgage History
| Date | Status | Borrower | Loan Amount |
|---|---|---|---|
| Open | Andre Michelle C | $247,450 | |
| Previous Owner | Walsh Kenneth J | $142,000 | |
| Previous Owner | Walsh Kenneth J | $19,503 | |
| Previous Owner | Walsh Kenneth J | $120,650 |
Source: Public Records
Tax History
| Year | Tax Paid | Tax Assessment Tax Assessment Total Assessment is a certain percentage of the fair market value that is determined by local assessors to be the total taxable value of land and additions on the property. | Land | Improvement |
|---|---|---|---|---|
| 2025 | $5,481 | $436,400 | $167,300 | $269,100 |
| 2024 | $5,235 | $407,100 | $152,800 | $254,300 |
| 2023 | $5,046 | $386,700 | $145,500 | $241,200 |
| 2022 | $4,938 | $350,700 | $121,300 | $229,400 |
| 2021 | $4,778 | $331,600 | $121,300 | $210,300 |
| 2020 | $4,634 | $325,900 | $121,300 | $204,600 |
| 2019 | $4,546 | $319,900 | $121,300 | $198,600 |
| 2018 | $4,311 | $299,200 | $116,600 | $182,600 |
| 2017 | $4,213 | $293,800 | $116,600 | $177,200 |
| 2016 | $3,985 | $278,900 | $114,700 | $164,200 |
| 2015 | $3,815 | $267,700 | $110,300 | $157,400 |
| 2014 | $3,832 | $261,400 | $107,700 | $153,700 |
Source: Public Records
Map
Nearby Homes
- 4 Little Tree Ln
- 70 Oswego St
- 21 Irving St
- 90 Pleasant St
- 82 Paine St
- 1250 Pulaski Blvd
- 49R Elm St
- 60 Freeman St
- 194 Paine St
- 11 Quail Run Rd
- 9 Brookfield Ln
- 202 Paine St
- 24 Palmetto Dr Unit 24
- 21 Palmetto Dr Unit 21
- 65 Palmetto Dr Unit 65
- 36 Indian Run Rd
- Lot 2 Pulaski Blvd
- 17 Susan Ln
- 178 Saint Louis Ave
- 9 Pebble Cir Unit 9
- 31 Brisson St
- 51 Brisson St
- 21 Brisson St
- 30 Brisson St
- 40 Brisson St
- 50 Brisson St
- 61 Brisson St
- 20 Brisson St
- 60 Brisson St
- 11 Brisson St
- 10 Brisson St
- 71 Brisson St
- 71 Brisson St Unit 71
- 71 Brisson St Unit L
- 71 Brisson St Unit R
- 71 Brisson St Unit 3
- 73 Brisson St
- 730 Pulaski Blvd
- 70 Brisson St
- 710 Pulaski Blvd
Your Personal Tour Guide
Ask me questions while you tour the home.