Estimated Value: $251,000 - $295,000
3
Beds
2
Baths
1,697
Sq Ft
$160/Sq Ft
Est. Value
About This Home
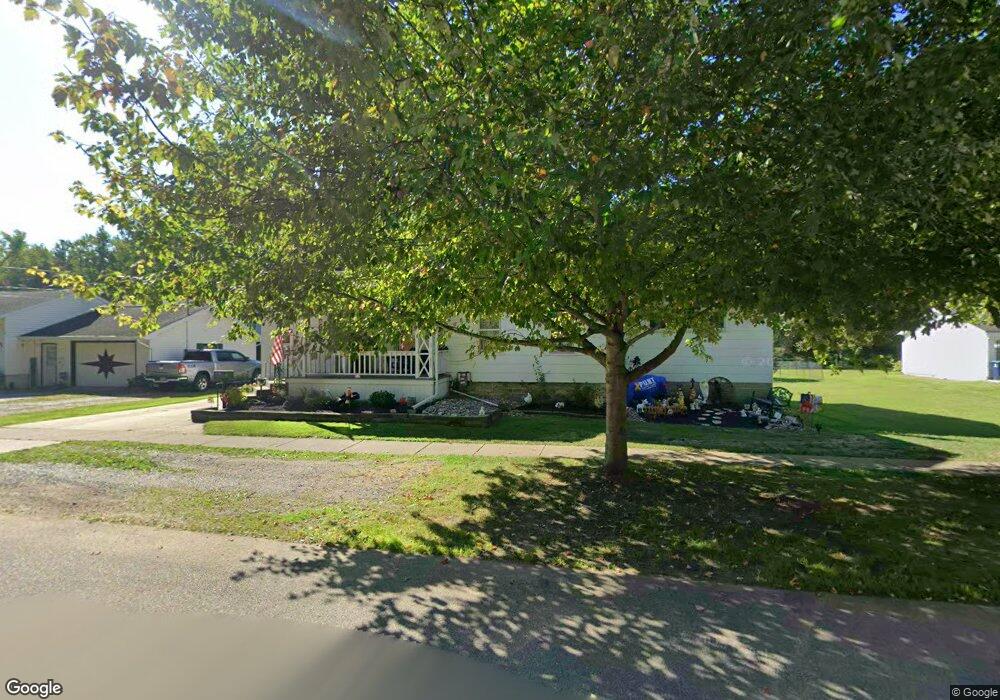
This home is located at 41 Brooklyn St, Akron, NY 14001 and is currently estimated at $272,271, approximately $160 per square foot. 41 Brooklyn St is a home located in Erie County with nearby schools including Akron Elementary School, Akron Middle School, and Akron High School.
Ownership History
Date
Name
Owned For
Owner Type
Purchase Details
Closed on
Jul 13, 2022
Sold by
Warren Scott M
Bought by
Warren Scott M and Warren Maureen M
Current Estimated Value
Purchase Details
Closed on
Apr 24, 2015
Sold by
Scutt Tina L and Warren Scott M
Bought by
Warren Scott M
Home Financials for this Owner
Home Financials are based on the most recent Mortgage that was taken out on this home.
Original Mortgage
$112,200
Outstanding Balance
$86,436
Interest Rate
3.76%
Mortgage Type
New Conventional
Estimated Equity
$185,835
Purchase Details
Closed on
Oct 30, 2007
Sold by
Schrock Ann M
Bought by
Scutt Tina L and Warren Scott M
Home Financials for this Owner
Home Financials are based on the most recent Mortgage that was taken out on this home.
Original Mortgage
$126,004
Interest Rate
6.39%
Mortgage Type
Purchase Money Mortgage
Create a Home Valuation Report for This Property
The Home Valuation Report is an in-depth analysis detailing your home's value as well as a comparison with similar homes in the area
Home Values in the Area
Average Home Value in this Area
Purchase History
| Date | Buyer | Sale Price | Title Company |
|---|---|---|---|
| Warren Scott M | -- | None Available | |
| Warren Scott M | -- | None Available | |
| Scutt Tina L | $119,900 | None Available |
Source: Public Records
Mortgage History
| Date | Status | Borrower | Loan Amount |
|---|---|---|---|
| Open | Warren Scott M | $112,200 | |
| Closed | Scutt Tina L | $126,004 |
Source: Public Records
Tax History
| Year | Tax Paid | Tax Assessment Tax Assessment Total Assessment is a certain percentage of the fair market value that is determined by local assessors to be the total taxable value of land and additions on the property. | Land | Improvement |
|---|---|---|---|---|
| 2024 | $2,977 | $175,000 | $44,600 | $130,400 |
| 2023 | $2,908 | $175,000 | $44,600 | $130,400 |
| 2022 | $2,971 | $139,900 | $27,500 | $112,400 |
| 2021 | $3,124 | $139,900 | $27,500 | $112,400 |
| 2020 | $3,371 | $139,900 | $27,500 | $112,400 |
| 2019 | $3,701 | $130,500 | $27,500 | $103,000 |
| 2018 | $3,538 | $130,500 | $27,500 | $103,000 |
| 2017 | $886 | $130,500 | $27,500 | $103,000 |
| 2016 | $3,331 | $130,500 | $27,500 | $103,000 |
Source: Public Records
Map
Nearby Homes
- 85 Main St
- 27 Bloomingdale Ave
- 81 Eckerson Ave
- 2 Clarence Center Rd
- 1 Clarence Center Rd
- 18 Brodies Way
- 68 Jackson St
- 70 Jackson St
- 4 Brodies Way
- 6335 Hake Rd
- 76 Jackson St
- 6315 Hake Rd
- 2 Brodies Way
- 0 Clarence Center Rd
- 12469 McNeeley Rd
- 00 Maple Rd
- 5646 Crittenden Rd
- 5666 Crittenden Rd
- 5656 Crittenden Rd
- 46 Golden Pond Pkwy
Your Personal Tour Guide
Ask me questions while you tour the home.