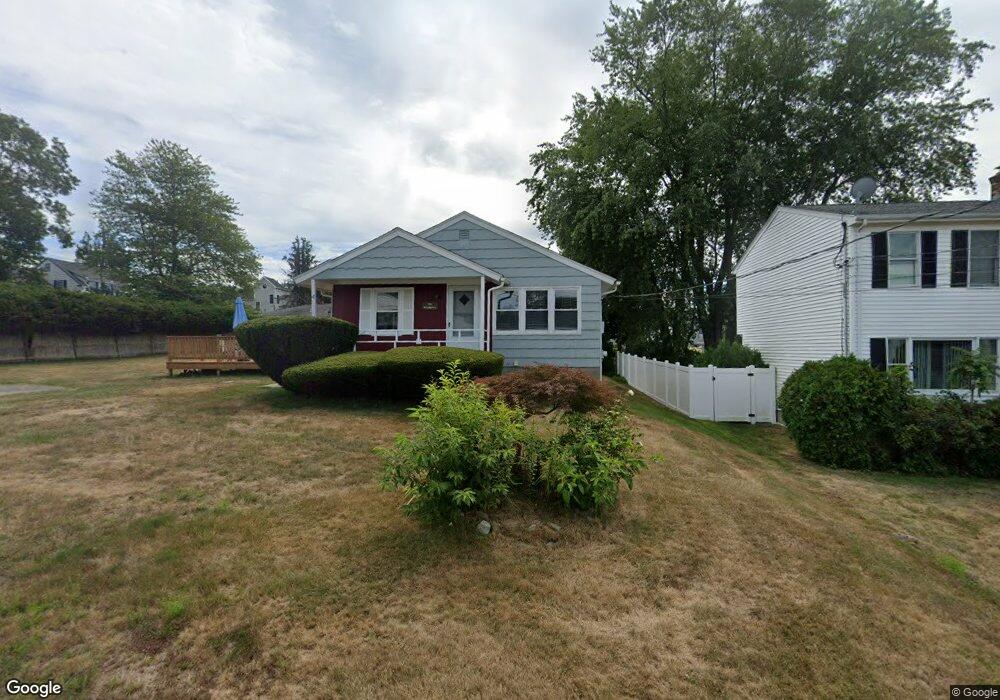
41 Burbank Ave Narragansett, RI 02882
Estimated Value: $795,000 - $1,036,000
3
Beds
1
Bath
1,066
Sq Ft
$863/Sq Ft
Est. Value
About This Home
This home is located at 41 Burbank Ave, Narragansett, RI 02882 and is currently estimated at $920,132, approximately $863 per square foot. 41 Burbank Ave is a home located in Washington County with nearby schools including Narragansett Elementary School, Narragansett Pier Middle School, and Narragansett High School.
Ownership History
Date
Name
Owned For
Owner Type
Purchase Details
Closed on
Dec 5, 2014
Sold by
Della-Selva James A and Della-Selva David
Bought by
Della-Selva Michael J and Della-Selva Shally J
Current Estimated Value
Home Financials for this Owner
Home Financials are based on the most recent Mortgage that was taken out on this home.
Original Mortgage
$200,000
Outstanding Balance
$155,605
Interest Rate
3.93%
Mortgage Type
New Conventional
Estimated Equity
$764,527
Create a Home Valuation Report for This Property
The Home Valuation Report is an in-depth analysis detailing your home's value as well as a comparison with similar homes in the area
Home Values in the Area
Average Home Value in this Area
Purchase History
| Date | Buyer | Sale Price | Title Company |
|---|---|---|---|
| Della-Selva Michael J | $182,500 | -- |
Source: Public Records
Mortgage History
| Date | Status | Borrower | Loan Amount |
|---|---|---|---|
| Open | Della-Selva Michael J | $200,000 |
Source: Public Records
Tax History Compared to Growth
Tax History
| Year | Tax Paid | Tax Assessment Tax Assessment Total Assessment is a certain percentage of the fair market value that is determined by local assessors to be the total taxable value of land and additions on the property. | Land | Improvement |
|---|---|---|---|---|
| 2024 | $4,985 | $761,000 | $525,100 | $235,900 |
| 2023 | $4,351 | $467,300 | $308,900 | $158,400 |
| 2022 | $4,206 | $467,300 | $308,900 | $158,400 |
| 2021 | $4,140 | $467,300 | $308,900 | $158,400 |
| 2020 | $4,058 | $387,200 | $232,500 | $154,700 |
| 2019 | $3,961 | $387,200 | $232,500 | $154,700 |
| 2018 | $3,853 | $387,200 | $232,500 | $154,700 |
| 2017 | $3,904 | $369,700 | $253,400 | $116,300 |
| 2016 | $3,727 | $369,700 | $253,400 | $116,300 |
| 2015 | $3,675 | $369,700 | $253,400 | $116,300 |
| 2014 | $3,712 | $369,700 | $253,400 | $116,300 |
Source: Public Records
Map
Nearby Homes
- 74 Bayberry Rd
- 18 Anawan Ave
- 55 Bonnet Shores Rd
- 0 Betty Dr
- 53 Bonnet Shores Rd
- 51 Bonnet Shores Rd
- 100 Algonquin Rd Unit 5
- 7 Leatherleaf Rd
- 727 Boston Neck Rd
- 55 S Ferry Rd
- 76 Battery Ln
- 1003 Fort Getty Rd
- 6 Arnold St
- 121 Spice Bush Trail
- 11 Tupelo Trail
- 9 Courtland Dr
- 30 Bonnet View Dr
- 18 Lakeview Dr
- 135 Cliff Dr
- 7 Laneway Ct
- 39 Burbank Ave
- 10 Parkman Rd
- 47 Burbank Ave
- 44 Burbank Ave
- 40 Burbank Ave
- 82 Treasure Rd
- 46 Burbank Ave
- 36 Burbank Ave
- 0 Parkman Rd
- 0 Parkman Ave
- 16 Parkman Rd
- 145 Col John Gardner Rd
- 8 Parkman Rd
- 34 Burbank Ave
- 50 Burbank Ave
- 145 Colonel John Gardner Rd
- 149 Colonel John Gardner Rd
- 7 Nassau Rd
- 11 Parkman Rd
- 15 Nassau Rd