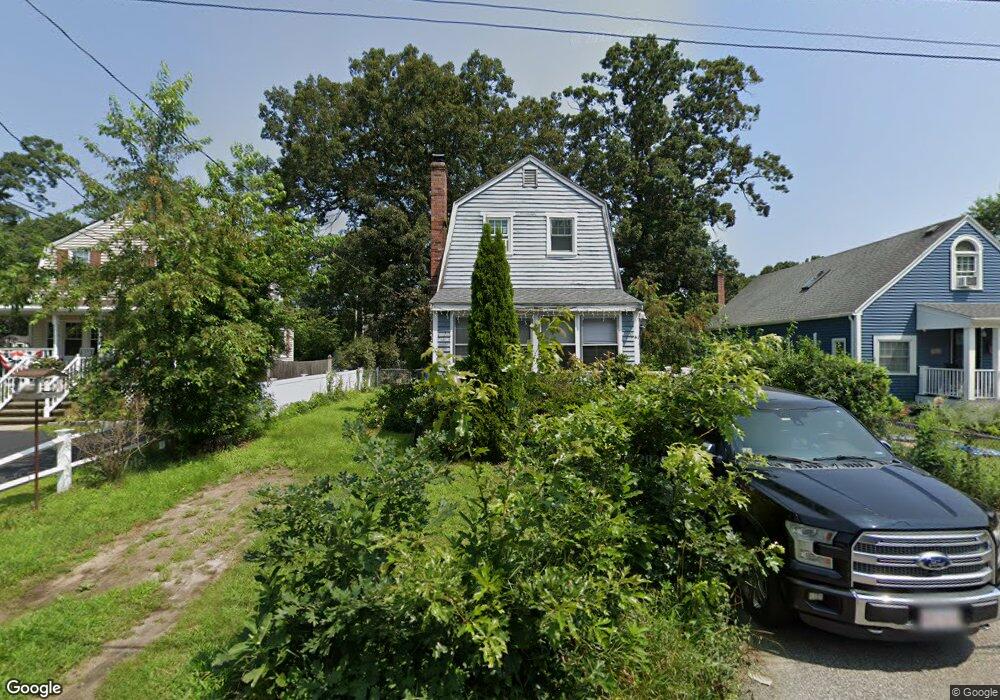
41 Burnap St Wilmington, MA 01887
Estimated Value: $489,000 - $669,000
3
Beds
1
Bath
1,536
Sq Ft
$393/Sq Ft
Est. Value
About This Home
This home is located at 41 Burnap St, Wilmington, MA 01887 and is currently estimated at $603,475, approximately $392 per square foot. 41 Burnap St is a home located in Middlesex County with nearby schools including Wilmington Middle School, Wilmington High School, and Abundant Life Christian School and Childcare.
Ownership History
Date
Name
Owned For
Owner Type
Purchase Details
Closed on
Jan 3, 2017
Sold by
Carbone Lori A and Carbone Steven M
Bought by
Carbone Lori A
Current Estimated Value
Home Financials for this Owner
Home Financials are based on the most recent Mortgage that was taken out on this home.
Original Mortgage
$293,500
Outstanding Balance
$240,618
Interest Rate
3.94%
Mortgage Type
New Conventional
Estimated Equity
$362,857
Purchase Details
Closed on
Jul 30, 1999
Sold by
Stevenson Robert J and Curran Beth-Anne
Bought by
Bourque Charlene F
Purchase Details
Closed on
Jun 27, 1996
Sold by
Remick Christopher
Bought by
Stevenson Robert J
Create a Home Valuation Report for This Property
The Home Valuation Report is an in-depth analysis detailing your home's value as well as a comparison with similar homes in the area
Home Values in the Area
Average Home Value in this Area
Purchase History
| Date | Buyer | Sale Price | Title Company |
|---|---|---|---|
| Carbone Lori A | -- | -- | |
| Bourque Charlene F | $170,000 | -- | |
| Stevenson Robert J | $134,400 | -- |
Source: Public Records
Mortgage History
| Date | Status | Borrower | Loan Amount |
|---|---|---|---|
| Open | Carbone Lori A | $293,500 | |
| Previous Owner | Stevenson Robert J | $266,800 | |
| Previous Owner | Stevenson Robert J | $20,000 |
Source: Public Records
Tax History Compared to Growth
Tax History
| Year | Tax Paid | Tax Assessment Tax Assessment Total Assessment is a certain percentage of the fair market value that is determined by local assessors to be the total taxable value of land and additions on the property. | Land | Improvement |
|---|---|---|---|---|
| 2025 | $5,085 | $444,100 | $248,200 | $195,900 |
| 2024 | $4,964 | $434,300 | $248,200 | $186,100 |
| 2023 | $4,737 | $396,700 | $225,700 | $171,000 |
| 2022 | $4,656 | $357,300 | $188,100 | $169,200 |
| 2021 | $4,387 | $317,000 | $171,000 | $146,000 |
| 2020 | $4,217 | $310,500 | $171,000 | $139,500 |
| 2019 | $4,007 | $291,400 | $162,800 | $128,600 |
| 2018 | $3,858 | $267,700 | $155,100 | $112,600 |
| 2017 | $3,511 | $243,000 | $147,700 | $95,300 |
| 2016 | $3,393 | $231,900 | $140,600 | $91,300 |
| 2015 | $3,276 | $228,000 | $140,600 | $87,400 |
| 2014 | $3,017 | $211,900 | $133,900 | $78,000 |
Source: Public Records
Map
Nearby Homes