
Landlord's Agent in 2024
Susan Connal
Coldwell Banker Realty
(203) 536-6655
2 in this area
17 Total Sales
Estimated Value: $2,888,000 - $7,133,000
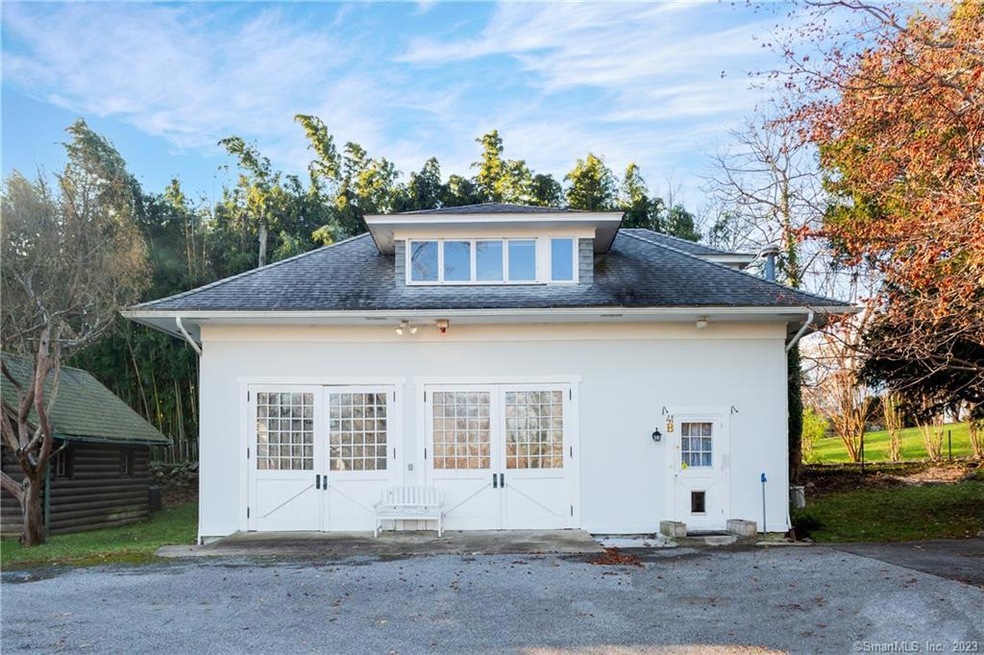
Remarks: Charming seaside Carriage House rental in an estate area, on Long Island Sound. Updated in 2011 with central air conditioning & extra insulation. Eat-in kitchen and bath, living room with water views and one bedroom. Washer and dryer available for tenant in garage. Large yard for tenant,, parking spaces available by the entry door. Owner uses the garage for storage. Landlord pays for grounds care, water, trash & snow removal. Tenant pays for gas, electric and security system. Wonderful location near Byram Park with beach, new Pool, tennis and boating. Directions: Shared driveway #41. Carriage house is first building on the right. #41B.
Last Agent to Rent the Property
Coldwell Banker Realty License #RES.0764033 Listed on: 12/28/2023
| Date | Buyer | Sale Price | Title Company |
|---|---|---|---|
| Friend Lynn E | -- | -- | |
| Friend | $389,932 | -- | |
| Friend | $315,033 | -- | |
| Friend | $315,033 | -- |
| Date | Event | Price | List to Sale | Price per Sq Ft |
|---|---|---|---|---|
| 01/04/2024 01/04/24 | Rented | $2,800 | 0.0% | -- |
| 01/02/2024 01/02/24 | Under Contract | -- | -- | -- |
| 12/28/2023 12/28/23 | For Rent | $2,800 | 0.0% | -- |
| 08/18/2023 08/18/23 | Rented | $2,800 | 0.0% | -- |
| 08/18/2023 08/18/23 | Under Contract | -- | -- | -- |
| 07/31/2023 07/31/23 | For Rent | $2,800 | -6.5% | -- |
| 12/30/2021 12/30/21 | Rented | $2,995 | +5.1% | -- |
| 12/29/2021 12/29/21 | Under Contract | -- | -- | -- |
| 10/05/2021 10/05/21 | Price Changed | $2,850 | -4.8% | $3 / Sq Ft |
| 09/21/2021 09/21/21 | For Rent | $2,995 | +5.1% | -- |
| 10/03/2019 10/03/19 | Rented | $2,850 | 0.0% | -- |
| 09/14/2019 09/14/19 | For Rent | $2,850 | +20.0% | -- |
| 05/20/2019 05/20/19 | Off Market | $2,375 | -- | -- |
| 05/05/2019 05/05/19 | Rented | $2,375 | 0.0% | -- |
| 03/01/2019 03/01/19 | Price Changed | $2,375 | -3.1% | $4 / Sq Ft |
| 01/22/2019 01/22/19 | For Rent | $2,450 | 0.0% | -- |
| 10/04/2018 10/04/18 | Rented | $2,450 | -14.0% | -- |
| 09/22/2018 09/22/18 | For Rent | $2,850 | 0.0% | -- |
| 09/16/2018 09/16/18 | Off Market | $2,850 | -- | -- |
| 09/16/2018 09/16/18 | For Rent | $2,850 | +22.6% | -- |
| 03/26/2018 03/26/18 | Rented | $2,325 | -2.1% | -- |
| 03/16/2018 03/16/18 | For Rent | $2,375 | +5.6% | -- |
| 03/09/2016 03/09/16 | Rented | $2,250 | 0.0% | -- |
| 03/09/2016 03/09/16 | Under Contract | -- | -- | -- |
| 03/04/2016 03/04/16 | Rented | $2,250 | -6.3% | -- |
| 02/03/2016 02/03/16 | Under Contract | -- | -- | -- |
| 11/30/2015 11/30/15 | For Rent | $2,400 | 0.0% | -- |
| 11/09/2015 11/09/15 | For Rent | $2,400 | -- | -- |
| Year | Tax Paid | Tax Assessment Tax Assessment Total Assessment is a certain percentage of the fair market value that is determined by local assessors to be the total taxable value of land and additions on the property. | Land | Improvement |
|---|---|---|---|---|
| 2025 | $53,503 | $4,329,080 | $3,953,740 | $375,340 |
| 2024 | $51,672 | $4,329,080 | $3,953,740 | $375,340 |
| 2023 | $50,373 | $4,329,080 | $3,953,740 | $375,340 |
| 2022 | $49,914 | $4,329,080 | $3,953,740 | $375,340 |
| 2021 | $47,600 | $3,953,460 | $3,605,350 | $348,110 |
| 2020 | $47,521 | $3,953,460 | $3,605,350 | $348,110 |
| 2019 | $47,995 | $3,953,460 | $3,605,350 | $348,110 |
| 2018 | $46,928 | $3,953,460 | $3,605,350 | $348,110 |
| 2017 | $47,503 | $3,952,340 | $3,605,350 | $346,990 |
| 2016 | $46,752 | $3,952,340 | $3,605,350 | $346,990 |
| 2015 | $51,875 | $4,350,080 | $4,200,000 | $150,080 |
| 2014 | $50,570 | $4,350,080 | $4,200,000 | $150,080 |
Landlord's Agent in 2024
Susan Connal
Coldwell Banker Realty
(203) 536-6655
2 in this area
17 Total Sales
Landlord's Co-Listing Agent in 2024
Jackie Hammock
Coldwell Banker Realty
(203) 561-0690
1 in this area
27 Total Sales
Tenant's Agent in 2024
Cosmo Iadanza
Century 21 AllPoints Realty
(917) 345-5504
23 Total Sales
Buyer's Agent in 2023
Jessica Bone
Coldwell Banker Realty
(203) 858-0761
8 Total Sales
D
Seller's Agent in 2021
Deborah Dahlgren
William Raveis Real Estate
(203) 249-3649
9 Total Sales
Buyer's Agent in 2019
Anthony Longo
William Raveis Real Estate
(203) 496-1922
1 in this area
56 Total Sales
Source: SmartMLS
MLS Number: 170616364
APN: GREE-000004-000000-001851-S000000
Disclaimer: Certain information contained herein is derived from information provided by parties other than Homes.com. All information provided is deemed reliable, but is not guaranteed to be accurate and should be independently verified.
![]() IDX information is provided exclusively for personal, non-commercial use, and may not be used for any purpose other than to identify prospective properties consumers may be interested in purchasing. Information is deemed reliable but not guaranteed.
IDX information is provided exclusively for personal, non-commercial use, and may not be used for any purpose other than to identify prospective properties consumers may be interested in purchasing. Information is deemed reliable but not guaranteed.