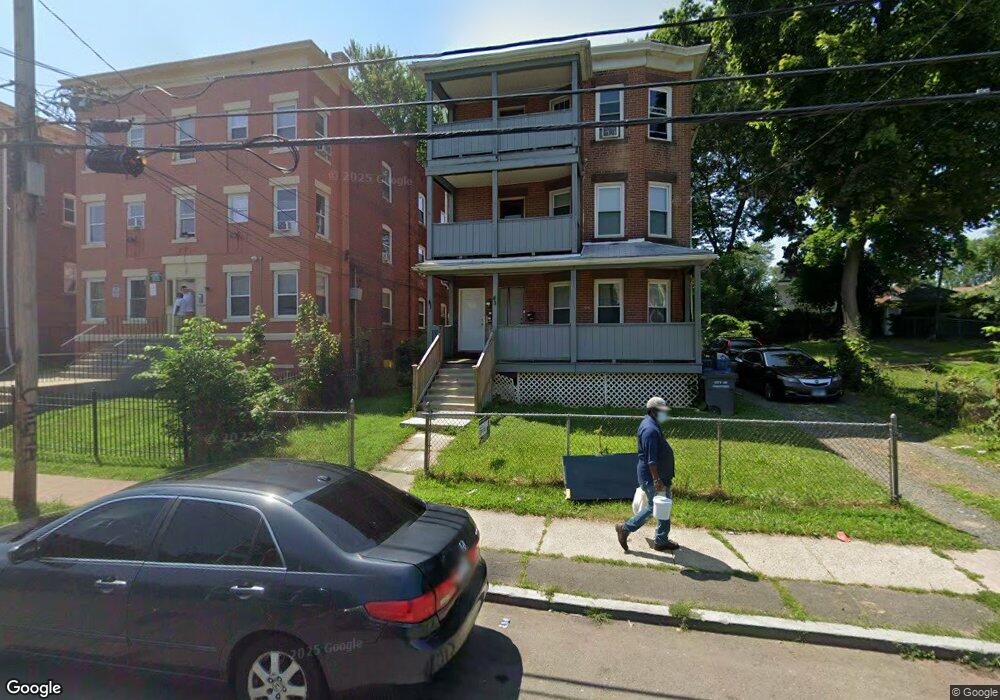
41 Cabot St Unit 43 Hartford, CT 06112
Upper Albany NeighborhoodEstimated Value: $407,000 - $516,000
6
Beds
3
Baths
3,963
Sq Ft
$114/Sq Ft
Est. Value
About This Home
This home is located at 41 Cabot St Unit 43, Hartford, CT 06112 and is currently estimated at $451,333, approximately $113 per square foot. 41 Cabot St Unit 43 is a home located in Hartford County with nearby schools including Noah Webster Micro Society School, Rawson School, and McKinley School.
Ownership History
Date
Name
Owned For
Owner Type
Purchase Details
Closed on
Feb 28, 2018
Sold by
Wells Fargo Bank Na
Bought by
Dickenson Yackecha
Current Estimated Value
Home Financials for this Owner
Home Financials are based on the most recent Mortgage that was taken out on this home.
Original Mortgage
$47,175
Interest Rate
4.04%
Mortgage Type
Commercial
Purchase Details
Closed on
May 8, 2017
Sold by
Clarke Joseth E and Wells Fargo Bank Na
Bought by
Wells Fargo Bank Na
Purchase Details
Closed on
Sep 28, 1993
Sold by
Campbell Dennis
Bought by
Clarke Joseph
Home Financials for this Owner
Home Financials are based on the most recent Mortgage that was taken out on this home.
Original Mortgage
$108,768
Interest Rate
7.1%
Mortgage Type
Purchase Money Mortgage
Create a Home Valuation Report for This Property
The Home Valuation Report is an in-depth analysis detailing your home's value as well as a comparison with similar homes in the area
Home Values in the Area
Average Home Value in this Area
Purchase History
| Date | Buyer | Sale Price | Title Company |
|---|---|---|---|
| Dickenson Yackecha | $53,507 | -- | |
| Wells Fargo Bank Na | $67,880 | -- | |
| Clarke Joseph | $110,000 | -- |
Source: Public Records
Mortgage History
| Date | Status | Borrower | Loan Amount |
|---|---|---|---|
| Closed | Clarke Joseph | $47,175 | |
| Previous Owner | Clarke Joseph | $108,768 | |
| Previous Owner | Clarke Joseph | $17,464 |
Source: Public Records
Tax History Compared to Growth
Tax History
| Year | Tax Paid | Tax Assessment Tax Assessment Total Assessment is a certain percentage of the fair market value that is determined by local assessors to be the total taxable value of land and additions on the property. | Land | Improvement |
|---|---|---|---|---|
| 2025 | $6,981 | $101,246 | $4,263 | $96,983 |
| 2024 | $6,981 | $101,246 | $4,263 | $96,983 |
| 2023 | $6,981 | $101,246 | $4,263 | $96,983 |
| 2022 | $6,981 | $101,246 | $4,263 | $96,983 |
| 2021 | $4,152 | $55,895 | $3,710 | $52,185 |
| 2020 | $4,152 | $55,895 | $3,710 | $52,185 |
| 2019 | $4,152 | $55,895 | $3,710 | $52,185 |
| 2018 | $4,012 | $54,011 | $3,585 | $50,426 |
| 2016 | $3,869 | $52,084 | $3,415 | $48,669 |
| 2015 | $3,686 | $49,610 | $3,253 | $46,357 |
| 2014 | $3,595 | $48,397 | $3,173 | $45,224 |
Source: Public Records
Map
Nearby Homes
- 68 Sterling St Unit 70
- 78-80 Cabot St
- 8 Sterling St
- 364 Woodland St
- 4 Deerfield Ave
- 240 Sargeant St
- 131-135,137-145,119- Albany Ave
- 290 Sargeant St Unit 292
- 62 Burton St
- 10 Burton St Unit 12
- 171 Edgewood St Unit 173
- 59 Magnolia St
- 52 Atwood St Unit 3B
- 25 May St
- 96 Sargeant St Unit 98
- 141 Greenfield St
- 134 Magnolia St Unit 136
- 251 Collins St
- 16 Townley St Unit G3
- 33 Sargeant St
- 33 Cabot St Unit 35
- 29 Cabot St Unit 31
- 40 Cabot St
- 40 Cabot St Unit 1
- 42 Cabot St Unit 44
- 25 Cabot St Unit 27
- 38 Cabot St Unit 40
- 46 Cabot St Unit 48
- 57 Cabot St
- 56 Sterling St Unit 58
- 52 Sterling St Unit 54
- 50 Cabot St Unit 52
- 30 Cabot St Unit 32
- 40 Sterling St Unit 42
- 48 Sterling St Unit 50
- 58 Cabot St Unit 60
- 58 Cabot St Unit 1st Floor
- 46 Sterling St
- 64 Sterling St Unit 66
- 54 Cabot St Unit 56