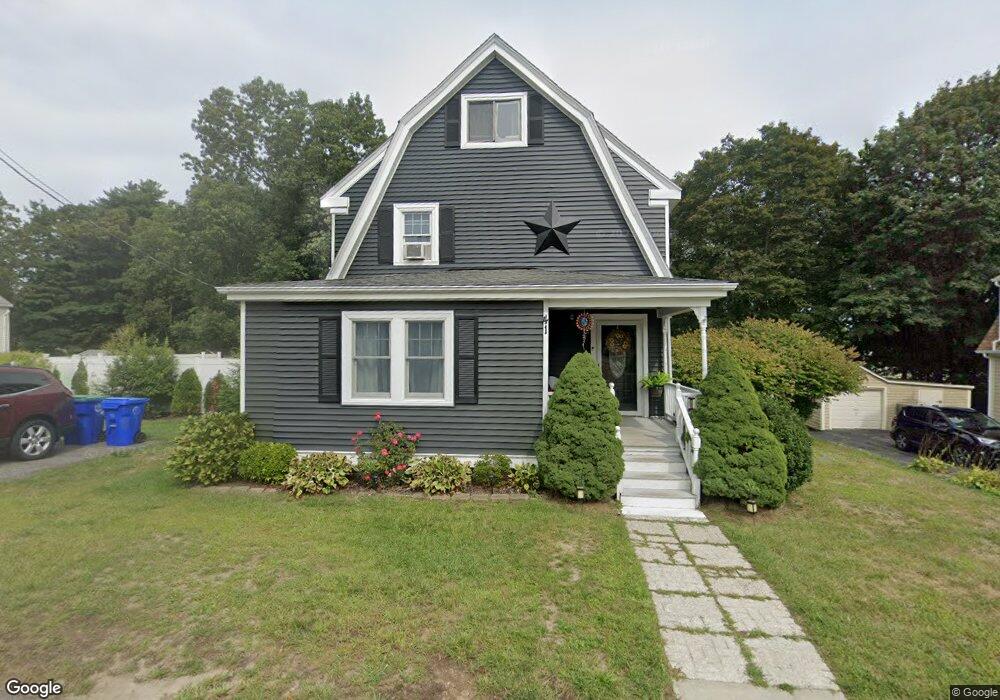
41 Carey St Rockland, MA 02370
Estimated Value: $559,000 - $596,542
3
Beds
2
Baths
1,878
Sq Ft
$307/Sq Ft
Est. Value
About This Home
This home is located at 41 Carey St, Rockland, MA 02370 and is currently estimated at $576,886, approximately $307 per square foot. 41 Carey St is a home located in Plymouth County with nearby schools including Rockland Senior High School, Calvary Chapel Academy, and St Bridget School.
Ownership History
Date
Name
Owned For
Owner Type
Purchase Details
Closed on
Jul 8, 2005
Sold by
Montalvo Miguel A and Montalvo Bernadette M
Bought by
Quinn Brian J
Current Estimated Value
Home Financials for this Owner
Home Financials are based on the most recent Mortgage that was taken out on this home.
Original Mortgage
$268,800
Outstanding Balance
$140,770
Interest Rate
5.71%
Mortgage Type
Purchase Money Mortgage
Estimated Equity
$436,116
Purchase Details
Closed on
Sep 29, 1989
Sold by
Whiting Elizabeth H
Bought by
Montalvo Miguel A
Create a Home Valuation Report for This Property
The Home Valuation Report is an in-depth analysis detailing your home's value as well as a comparison with similar homes in the area
Home Values in the Area
Average Home Value in this Area
Purchase History
| Date | Buyer | Sale Price | Title Company |
|---|---|---|---|
| Quinn Brian J | $336,000 | -- | |
| Montalvo Miguel A | $168,900 | -- |
Source: Public Records
Mortgage History
| Date | Status | Borrower | Loan Amount |
|---|---|---|---|
| Open | Montalvo Miguel A | $19,700 | |
| Open | Montalvo Miguel A | $268,800 |
Source: Public Records
Tax History Compared to Growth
Tax History
| Year | Tax Paid | Tax Assessment Tax Assessment Total Assessment is a certain percentage of the fair market value that is determined by local assessors to be the total taxable value of land and additions on the property. | Land | Improvement |
|---|---|---|---|---|
| 2025 | $7,143 | $522,500 | $232,200 | $290,300 |
| 2024 | $6,933 | $493,100 | $219,000 | $274,100 |
| 2023 | $6,738 | $442,700 | $190,900 | $251,800 |
| 2022 | $6,455 | $385,400 | $166,000 | $219,400 |
| 2021 | $5,913 | $342,200 | $150,900 | $191,300 |
| 2020 | $4,447 | $326,000 | $143,700 | $182,300 |
| 2019 | $5,613 | $313,200 | $136,900 | $176,300 |
| 2018 | $5,335 | $292,800 | $136,900 | $155,900 |
| 2017 | $5,023 | $271,800 | $129,700 | $142,100 |
| 2016 | $4,835 | $261,500 | $124,700 | $136,800 |
| 2015 | $4,845 | $254,600 | $116,600 | $138,000 |
| 2014 | $4,677 | $255,000 | $114,300 | $140,700 |
Source: Public Records
Map
Nearby Homes
- 46 Wardson Cir
- 122 Reed St
- 11 Chestnut Cir
- 119 Grove St Unit 238
- 119 Grove St Unit 223
- 135 Grove St Unit 110
- 103 Grove St Unit 337
- 6 Chestnut Cir
- 100 North Ave
- 28 Nevens Cir
- 20 Birch St
- 1 Canterbury Ln
- 50 Linden Park
- 225 W Water St
- 40 Fir Rd Unit 386
- 140 W Water St
- 27 Fir Rd
- 45-47 Park St
- 11 Dyer St Unit 11
- 13 Dyer St Unit 13