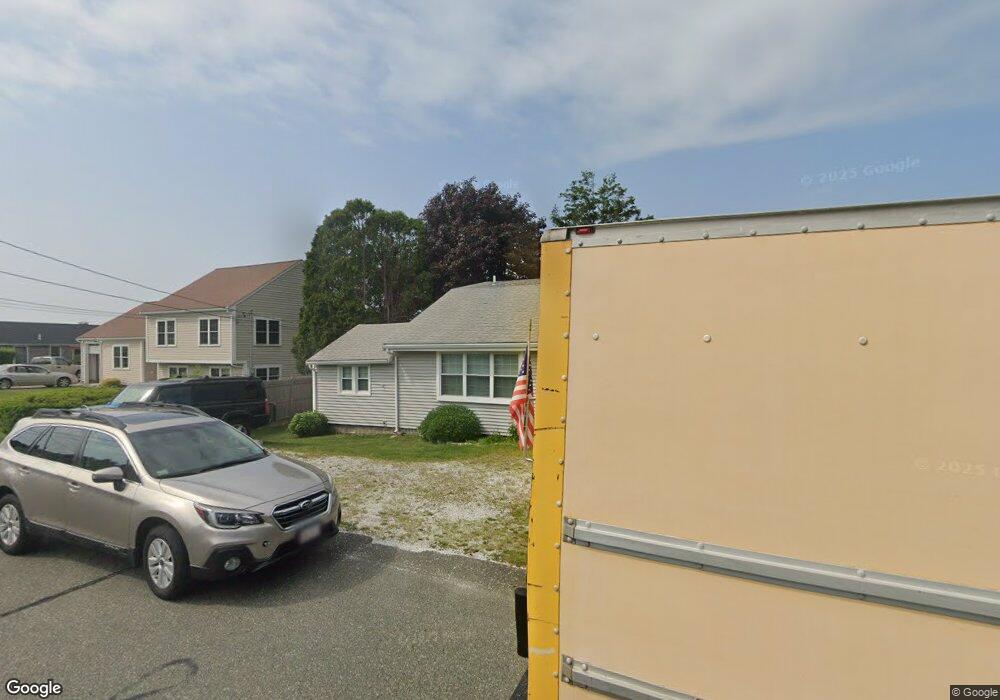
41 Carman Ave Sandwich, MA 02563
Estimated Value: $763,379 - $860,000
4
Beds
2
Baths
1,596
Sq Ft
$521/Sq Ft
Est. Value
About This Home
This home is located at 41 Carman Ave, Sandwich, MA 02563 and is currently estimated at $831,095, approximately $520 per square foot. 41 Carman Ave is a home located in Barnstable County with nearby schools including Sandwich Middle High School, Waldorf School of Cape Cod, and Bridgeview Montessori School.
Ownership History
Date
Name
Owned For
Owner Type
Purchase Details
Closed on
Nov 16, 2021
Sold by
Hull Mark E and Hull Sheila A
Bought by
Hull Ft
Current Estimated Value
Purchase Details
Closed on
Aug 30, 2010
Sold by
Sanders Judith P
Bought by
Hull Mark E and Hull Sheila A
Home Financials for this Owner
Home Financials are based on the most recent Mortgage that was taken out on this home.
Original Mortgage
$269,600
Interest Rate
4.57%
Mortgage Type
Purchase Money Mortgage
Purchase Details
Closed on
Jun 19, 2009
Sold by
Arone Robert L
Bought by
Sanders Judith P
Create a Home Valuation Report for This Property
The Home Valuation Report is an in-depth analysis detailing your home's value as well as a comparison with similar homes in the area
Home Values in the Area
Average Home Value in this Area
Purchase History
| Date | Buyer | Sale Price | Title Company |
|---|---|---|---|
| Hull Ft | -- | None Available | |
| Hull Mark E | $337,000 | -- | |
| Sanders Judith P | $308,000 | -- |
Source: Public Records
Mortgage History
| Date | Status | Borrower | Loan Amount |
|---|---|---|---|
| Previous Owner | Hull Mark E | $269,600 |
Source: Public Records
Tax History Compared to Growth
Tax History
| Year | Tax Paid | Tax Assessment Tax Assessment Total Assessment is a certain percentage of the fair market value that is determined by local assessors to be the total taxable value of land and additions on the property. | Land | Improvement |
|---|---|---|---|---|
| 2025 | $6,569 | $621,500 | $361,400 | $260,100 |
| 2024 | $5,903 | $546,600 | $301,200 | $245,400 |
| 2023 | $5,750 | $500,000 | $273,800 | $226,200 |
| 2022 | $5,300 | $402,700 | $220,000 | $182,700 |
| 2021 | $5,153 | $374,200 | $211,500 | $162,700 |
| 2020 | $4,973 | $347,500 | $193,200 | $154,300 |
| 2019 | $4,757 | $332,200 | $187,800 | $144,400 |
| 2018 | $4,360 | $305,100 | $170,500 | $134,600 |
| 2017 | $4,231 | $283,400 | $158,000 | $125,400 |
| 2016 | $4,030 | $278,500 | $156,400 | $122,100 |
| 2015 | $3,932 | $265,300 | $147,100 | $118,200 |
Source: Public Records
Map
Nearby Homes
- 54 Carman Ave
- 59 Tupper Ave
- 10 Chadwell Ave
- 33 Dexter Ave
- 69 Knott Ave
- 12 Freeman Ave
- 14 Freeman Ave
- 1-3 White Cap Path Unit 1&3
- 5 White Cap Path Unit 5
- 32 Church St
- 5 Canary St
- 19 Willow St
- 1 Swann Hill Ln
- 7 Sunrise Ln
- 43 Jarves St
- 71 Tupper Rd
- 114 Tupper Rd Unit 4B
- 114 Tupper Rd Unit 4B
- 27 Moody Dr